Direct Answer
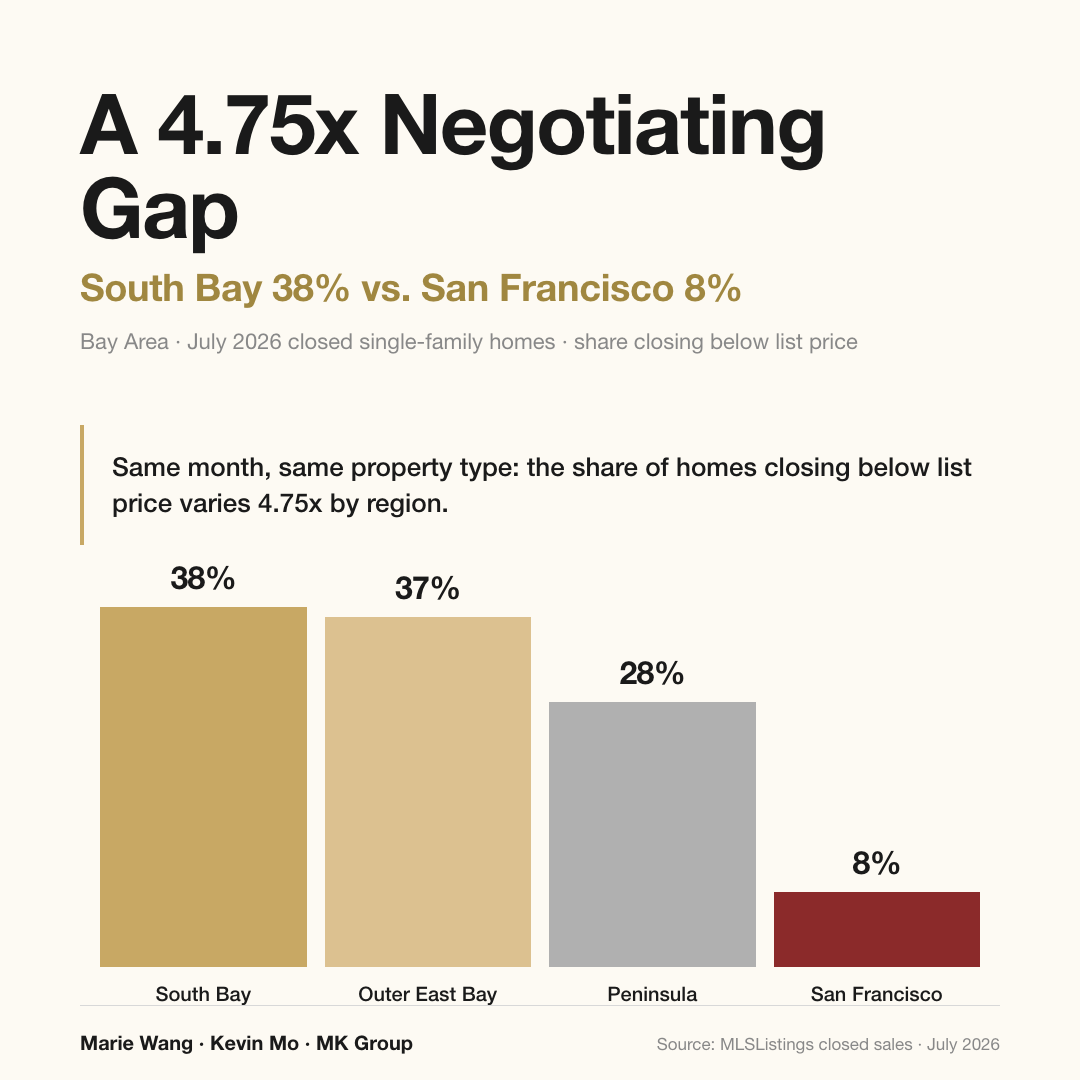
Yes — the room is just distributed very unevenly. Among July 2026 MLS single-family closings, the share that finished below list price was 38% in the South Bay, 37% in the outer East Bay, 28% on the Peninsula, and 8% in San Francisco. That is a 4.75x spread. So the question isn't whether a buyer can still negotiate. It's which square you happen to be standing on.
Who this article is for
- Bay Area buyers who haven't locked a region yet and want to see which part of the market is friendliest to them before they start touring
- Families with a $2.5M–$4M budget who feel like every house is being fought over and want to know whether that feeling is accurate
- Buyers working with $6M+ who need a real read on what to offer at the top of the market
- Anyone who saw "prices up 25% in a year" and decided to wait, and wants to test that decision against the closing data
- Bay Area owners preparing to list who want to know exactly which numbers the buyer on the other side is holding
Three ways to read the market
One: the 25% is real, and it is not a decision input
Start by settling the appreciation question, because it is true. A published monthly market report for June put San Francisco's median single-family price at $2,150,000, up 26.5% year over year. Run the same question through MLS data and the answer barely moves: the median sale price for a single-family home in San Francisco in July went from $1,630,000 a year ago to $2,050,000, a 25.8% gain. Two methods, less than a percentage point apart.
The problem is that a 25% gain is background noise to a buyer. It doesn't tell you whether to act, and it doesn't tell you what to write on the offer. The number that converts into action is the other half of the same data: how many homes actually finished below list. Counting over-list sales is the seller's view of the market. Turning the same set of closings over and counting the ones that went under is the buyer's.
That inversion is the whole method here. Every figure below comes from the same pool — MLS closed sales, single-family detached only, no condos and no townhomes, data through July 2026 — read from the buy side rather than the sell side.
Two: region sets the starting line, price band sets the difficulty
The order matters and cannot be reversed. Region establishes where you begin. Same month, same property type, and the probability of a seller conceding on price varies 4.75x between the South Bay and San Francisco. Price band then applies a difficulty multiplier on top of that starting position, and the Bay Area's ordering is not the intuitive one. It is not "cheaper is easier" — in July the $2.5M–$4M band was harder to negotiate than the $6M+ band above it.
Only after both layers are stacked do you know the rough conditions you are negotiating under. Skip the first and you misjudge the whole market. Skip the second and you walk into the tighter band assuming it should behave like the one above it.
Three: the last layer is always the house itself
Regional averages and band shares are statistics. Applied to one specific house, three things decide the outcome: how long it has been on the market, whether it has already taken a price reduction, and what kind of time pressure the seller is under. A house that has sat unsold for six months and a house that listed last week are two completely different negotiations, even inside the same ZIP code — and the ZIP code average will tell you nothing about which one you are looking at.
All three are checkable before an offer is written, and none of them require an insider. Days on market is published, though the figure that matters is cumulative time across any relisting rather than the count that resets when a property is withdrawn and brought back a month later. A price reduction is public record and, more usefully, a statement of position: a seller who has already moved once has established that the first number was negotiable. Time pressure is the softest of the three and usually the most decisive — a probate sale, a relocation, a purchase already in contract on the other side, or a carrying cost nobody planned to hold through another quarter. Regional data tells you what to expect walking in. These three tell you what is actually true of the house in front of you.
Five regions, from 38% down to 8%
The headline numbers first. Among July 2026 MLS single-family closings, 38% of South Bay homes sold below list price, alongside 37% in the outer East Bay, 28% on the Peninsula, and 8% in San Francisco. Put another way: in the South Bay and the outer East Bay close to four sellers in ten ended up conceding, which makes negotiating there ordinary rather than exceptional. In San Francisco roughly one closing in twelve managed it. The count covers MLS closed records for single-family detached homes only — no condos, no townhomes.
| Region | Share closing below list | How to read it |
|---|---|---|
| South Bay | 38% | Highest of the four comparable regions; price concessions are routine |
| Outer East Bay | 37% | Effectively level with the South Bay |
| Peninsula | 28% | Middle of the pack — roughly one in every 3.5 closings finished under list |
| San Francisco | 8% | Tightest of the four comparable regions |
| Inner East Bay (Oakland / Berkeley) | — (priced differently; not directly comparable) | 78% of closings finished above list, because the local convention is to list low and invite competing bids |
The row to hold on to is the last one. An inner East Bay over-list rate of 78% looks like the hottest market in the region, and it isn't a measurement of heat at all. The common listing practice there is to set the price deliberately low and let several buyers bid it up, which inflates the over-list share by construction. That row cannot be measured with the same ruler as the four above it, which is why it carries no below-list figure here rather than a made-up one.
The first four rows are something more useful: a value map. The 4.75x gap between the South Bay's 38% and San Francisco's 8% is a starting position that is fixed before you ever open your mouth. A buyer who is regionally flexible has already made the single largest negotiating decision available to them, and made it before touring a single house.
Price bands: why $2.5M–$4M negotiates harder than $6M+
The headline numbers first. Break July's Santa Clara and San Mateo county closings out by price band and the middle of the market comes out tighter than the top. The harder of the two bands to negotiate is $2.5M–$4M, where only 29% of sales closed below list. Above it, the market loosens: pull the $6M+ closings across Santa Clara, San Mateo and San Francisco together and you get 119 sales, an $8.04M median sale price, 45% of them closing below list, and a median of 13 days on market.
| Price band | Share closing below list | Other key figures |
|---|---|---|
| $2.5M–$4M | 29% | The tighter of the two bands measured |
| $6M+ (Santa Clara + San Mateo + San Francisco combined) | 45% | 119 closings, $8.04M median sale price, 13 median days on market |
Two counterintuitive things are worth carrying out of that table. The first is why $2.5M–$4M is the squeeze point. Two separate buyer pools land in that band at once: families trading up out of the entry tier, and families who wanted to buy higher and were pulled back down into it by what their budget actually clears. Two waves of demand stack on the same inventory, and the room to concede compresses to almost nothing.
The second runs against the popular picture of the luxury market entirely. Nearly half of $6M+ closings finished below list, and averaged across the band the closing price lands roughly back at the original ask. That is not a story about wealthy buyers fighting each other. It is a story about a small pool of buyers who can clear the price, few genuinely comparable sales to anchor against, looser pricing strategy, and houses that are each so specific that no comp set really covers them. When those four conditions hold, the accuracy of a list price necessarily degrades — and an imprecise list price is negotiating room by another name. For how the pattern behaves further up, see whether $20M+ Bay Area homes are still negotiable; for what to actually deduct when you tour a reduced $10M Atherton listing, see the Atherton $10M–$14M showing checklist.
For a buyer sitting inside the tight band, the practical response is not to abandon the budget. It is to open up the two variables that remain. Region is the larger of the two, and the four shares in the table above are the map for it. Condition is the second: in a compressed band the houses that concede are almost always the ones carrying something the next owner has to deal with, which means the room is there, priced into a problem, rather than missing. What does not work is waiting for the band to loosen on its own. Two waves of demand stacked on one tier of inventory is a structural feature of this market, not a seasonal one.
Northern California's biggest sale of the year closed 20.5% under list
On August 6, 2026, a Hillsborough estate recorded at $70M and set two records at once: the highest-priced residential sale in Northern California in 2026, and the highest-priced residential sale in Hillsborough's history. The previous Hillsborough record was $35M in 2022 — the ceiling doubled in four years. The specifications are what you would expect at that number: a 12,000-square-foot main house plus a 4,600-square-foot guest house, 12 acres, six bedrooms and twelve baths, a gym, an outdoor amphitheater, and a pool. Reporting on the property puts construction at six years and more than 110 subcontractors.
None of that is the part a buyer should file away. The useful part is the listing trajectory: the property came to market publicly in February 2026 at $88M and closed at $70M. That is a 20.5% reduction off ask.
Both facts are worth holding at the same time. The ceiling in this market doubled in four years, and the house that set the new ceiling still closed $18M below its own asking price. Those are not competing readings of the same market. They describe two different things: how far the top of the range can now reach, and how precisely anyone can locate that point in advance.
Two lessons follow. The first is that a list price is not a verdict. The higher the total, the thinner the comparable set, and the more of the list price is simply a test of what the market will bear — $88M was never a computed number to begin with. The second is the one worth remembering longer. This estate sits in Hillsborough's 94010, which is among the firmest, hardest-to-negotiate ZIP codes on the Peninsula. The largest sale of the year happened there, and it still conceded 20%. That is the third dimension stated as plainly as it can be stated: the regional average decides your starting line, and the individual property's circumstances decide the room you actually have.
How layoffs and rising prices happen at once: who you are actually bidding against
Santa Clara and San Mateo counties recorded 7,295 filed layoffs through June 30, 2026. That threshold only captures employers of 200 or more cutting 50 or more people at a time, so the real figure is higher — this is a floor, not a total. Even as a floor, the first half of the year alone came to roughly 90% of all of last year. Layoffs accelerating while prices climb looks like a contradiction, right up until you look at who is actually buying.
Take closings that finished more than $1M over list. From February 2024 through February 2026 — two full years — no single month exceeded nine of them, and most months had none at all. Then March 2026 came in around 20. April and May each cleared 30. June hit 44. San Francisco's cumulative total for the first half of the year was 144. That curve doesn't drift upward; it steps.
Two other figures sit alongside it. Between April and June 2026, 30% of Bay Area closings were all-cash, against under 20% in 2021. And the median down payment among Bay Area luxury buyers ran 35% last year, against 28.4% before the 2023 rate spike.
The conclusion is direct. The 7,000-plus people who lost jobs and the buyers willing to go $1M over list, put 35% down, or pay cash outright are two capital pools that do not overlap. That is how layoffs and price appreciation coexist — and in the regions where the over-list share is high, the second pool is your competition. Against that opponent, raising your price is rarely the effective lever. Certainty is. How thoroughly the funds are prepared, whether the ownership structure is set up in advance, how far the inspection contingency and the closing timeline can flex toward the seller. Offer structure and contingency design are covered in full in our Bay Area offer strategy guide.
In practice that resolves into a handful of things a listing agent can verify in an afternoon: proof of funds covering the purchase rather than the down payment, a lender who has underwritten the file rather than pre-qualified the borrower, an inspection window measured in days because the disclosure package was read before the offer went in, and a closing date built around the seller's calendar instead of the buyer's. None of it costs money. All of it reads, from the other side of the table, as a transaction that will not come apart in week three — which is the risk a seller is really pricing when they accept a lower number.
What MK Group sees in the field
How certainty converts into price: roughly $700K off an off-market Palo Alto purchase
One MK Group off-market purchase in Palo Alto (case-026 in our case library) belongs next to this data set. The owner was already preparing to list — belongings were being moved out, staging was nearly arranged — and MK Group intercepted in the final stage before the listing went live, closing below what the seller had expected rather than talking them out of listing by paying more. The roughly $700K reduction rested on three arguments, each made item by item: a condition comparison against recent nearby comps, the additional time and cost the seller would carry by going to the open market, and the buyer's high certainty on funds and closing. Kevin Mo set the tempo, working to a roughly 10-day window from the outset. Marie Wang's line on that step: "This can't move too fast — it needs some grinding before it can settle." (Translated from Mandarin.) How these transactions come together is laid out in how Silicon Valley off-market deals actually happen.
The room at the top is real: over $1M off in Los Altos Hills
A second transaction, this one at the top of the market (case-007), illustrates the same logic. A family working at a leading Silicon Valley AI company converted pre-IPO shares into cash in tranches through the secondary market, then bought a Los Altos Hills estate all-cash. MK Group took over the negotiation and brought the price down by more than $1M from the original ask; the absolute closing price was not disclosed. What made the difference was not that the buyer bid higher. It was that the buyer had pushed certainty of funds as far as it can be pushed.
That outcome is not an exception at the top of the market. It is what the top of the market looks like when a buyer arrives holding the one thing a seller at that level cannot manufacture for themselves: a closing that does not depend on a lender's timeline.
One current signal sits outside the data. Kevin Mo notes on YouTube @KevinMoRE (23K+ subscribers) that the team recently helped a client buy a single-family home in Sunnyvale that the same budget would not have reached in the past. That is consistent with the $2.5M–$4M read: still tight, and genuinely less frantic than it was.
Common Misconceptions
"Prices rose 25% in a year, so there is no chance of negotiating anything off right now"
Appreciation and concession probability are two independent numbers. It is true that San Francisco's median single-family sale price in July was up 25.8% year over year. It is equally true that within the same set of closings, 38% of South Bay sales, 37% of outer East Bay sales, and 28% of Peninsula sales finished below list. Appreciation describes the price level over the past twelve months. The below-list share describes the outcome of the transaction sitting in front of you. Inferring the second from the first points you in the wrong direction.
"The luxury band is the hardest to negotiate — wealthy buyers are fighting over those houses"
The $6M+ band closed below list 45% of the time, well clear of the 29% recorded at $2.5M–$4M. The reason is not that sellers at the top are weaker. It is that fewer buyers can clear the price, fewer comparable sales exist to price against, pricing strategy is looser, and each property is close to one of a kind. Northern California's highest sale of the year is the case in point: $88M asked, $70M closed.
"The cheaper the house, the easier it is to negotiate"
July's data does not support that. The $2.5M–$4M band closed below list 29% of the time against 45% for the $6M+ band above it — the middle was tighter than the top. That band absorbs buyers trading up out of the entry tier and buyers pulled back down from higher price points by what their budget actually clears, and with both waves landing on the same inventory the room to concede compresses to almost nothing. A family whose budget sits squarely in that band often finds more room by stepping up rather than staying put.
"If I look up the average below-list share for my target area, I'll know how much I can cut"
Regional averages set the starting line and nothing beyond it. Hillsborough's 94010 is among the hardest ZIP codes in the region to negotiate, and it produced a 20.5% concession on the largest sale of the year. The reverse holds too: the South Bay's 38% is no guarantee that the specific house you want will concede anything. What decides the room is that house's own three variables — days on market, whether it has taken a price reduction, and the seller's time pressure.
"The region with the highest over-list share is the hottest region"
The inner East Bay's over-list share reaches 78%, but the common listing practice there is to price low deliberately and let multiple buyers bid it up, which inflates the over-list figure by construction. Held to the same pricing convention, it is not necessarily hotter than the Peninsula. Comparing heat across regions requires first confirming that both sides price the same way — otherwise the number points the right direction and the conclusion comes out backwards.
Next steps
- Set your starting line with the regional shares. Below-list closings ran 38% in the South Bay, 37% in the outer East Bay, 28% on the Peninsula, and 8% in San Francisco. If your region isn't locked yet, those four numbers are the largest single decision on the table.
- Then find your price band. $2.5M–$4M ran 29% below list against 45% for $6M+. Establish whether you are standing in the tighter square before you write anything.
- Build certainty instead of bidding up. Your competition may be paying cash or putting 35% down. Financing pre-approval, inspection scheduling, and closing flexibility are the three levers actually under your control.
- Check three things on every single house: how long it has been listed, whether it has already taken a price reduction, and what time pressure the seller is under.
- If you are the seller, assume the buyer already has these numbers. The 38% South Bay and 37% outer East Bay concession rates are publicly checkable, so the listing plan has to be built for a buyer who is holding data — see pricing strategy for a Bay Area sale.