This Pulse issue analyzes 2,986 SFR closings across the Bay Area in Q1 2026 (63 cities, 9 counties), with the first hard year-over-year comparison versus the Q1 2025 baseline now archived. Three headline findings: mortgage rates fell 72 bps YoY yet $10M-$20M cash share rose 9.8pp (76.9% → 86.7%), confirming luxury credit decoupling longitudinally; $20M+ Q1 closings jumped from 2 to 6 (3×) with median DOM compressing from 144 days to 9 days; $10M+ closings rose 40% YoY (15 → 21) while total volume rose only 2.9%, moving the Bay Area K-shaped split from trend to structural fact. Sourced from MLSListings and FRED, with full methodology transparency.
Scroll the PDF for the full report; the web version below adds clickable links and embedded charts.
- Mortgage rates fell 72 bps YoY (6.83% → 6.11%), yet $10M-$20M cash share moved the opposite way — from 76.9% to 86.7%. Lower rates didn't pull mortgage buyers back into luxury; they pushed mid-tier capital further up the ladder.
- $20M+ closings jumped from 2 (Q1 2025) to 6 (Q1 2026); median DOM compressed from 144 days to 9 days; median sale/original climbed from 90.7% to roughly 100% — the same band shifted from seller-concession clearance to list-tight competition within 12 months.
- $10M+ luxury closings rose 40% YoY (15 → 21) while total volume rose only 2.9% — the Bay Area's K-shaped split moved from trend to structural fact in Q1 2026.
1. The 30-Second Read
This issue draws on 2,986 single-family residence (SFR) closings in the Bay Area during Q1 2026 (CloseDate January 1 through March 31), spanning 9 counties and 63 cities, sourced from MLSListings.
- Q1 SFR median sale price $1.65M, median days on market 8, median sale-to-list ratio 104% — a structurally tight seller's market continues.
- All-cash share rises step-wise with price: under $1.5M, 17%; $5M–$10M, 54%; $10M–$20M, 87%; $20M+, 100%.
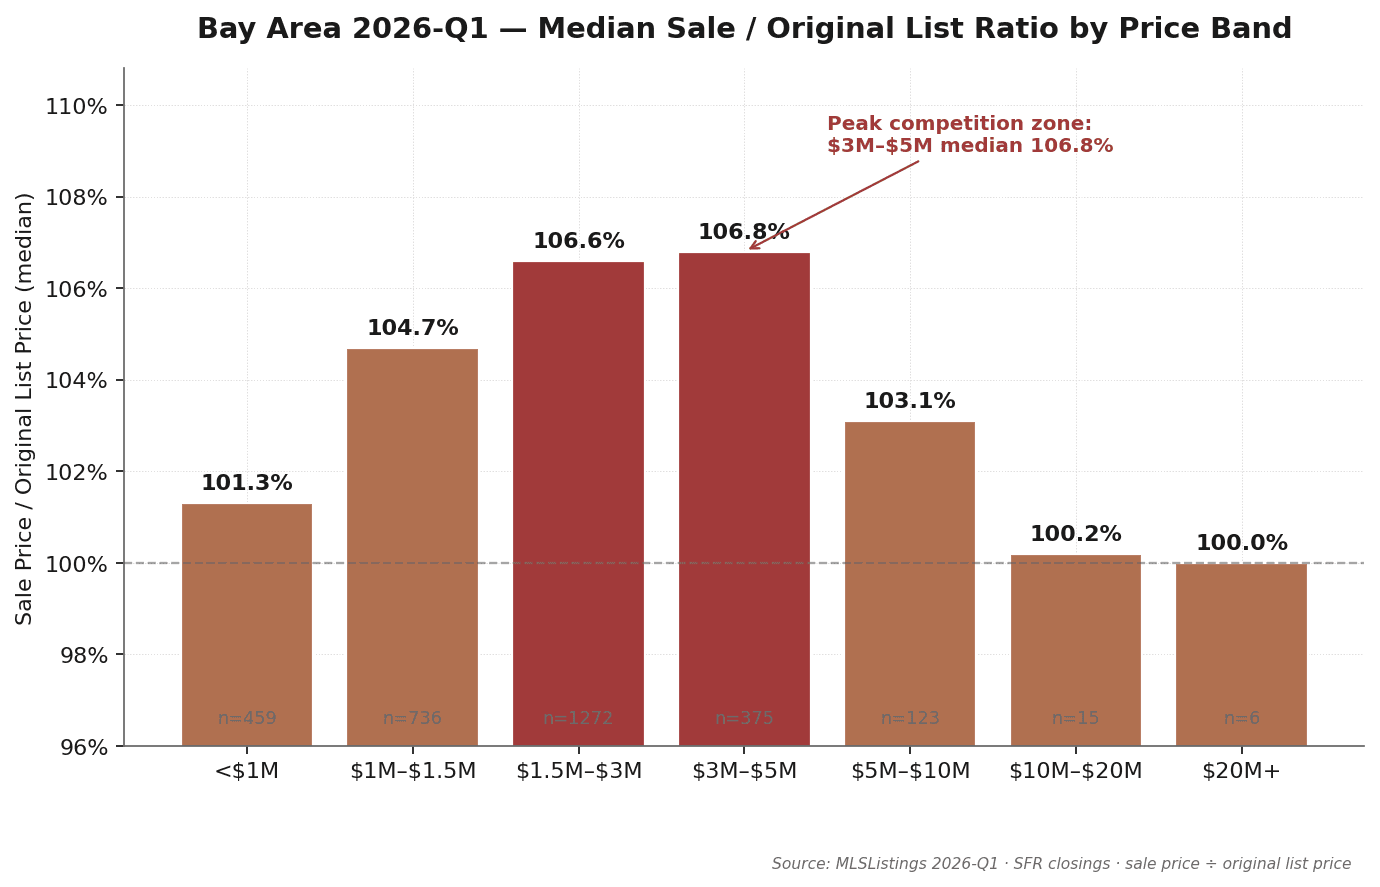
- The most competitive price band is $3M–$5M, with median sale-to-original-list ratio at 106.8% — above every higher band.
- Only 6 transactions over $20M closed in the entire Bay Area in Q1. Median DOM 9 days.
- Palo Alto Q1: 61 closings, median $4.12M, 51% cash. The premier school-tier segment is past majority all-cash.
- Quarter-to-date (April 1 – May 15, 1,354 closings) suggests Q1 dynamics carry into Q2.
Source: MLSListings Q1 2026 SFR closings · MK Group · Field definitions in Section 9.
2. Bay Area Fundamentals: Four Baseline Numbers
Q1 2026 Bay Area SFR market is summarized most accurately by four numbers:
| Metric | Q1 2026 Median | Interpretation |
|---|---|---|
| Total closings | 2,986 | 9 counties, 63 cities combined |
| Median sale price | $1.65M | All price bands aggregated |
| Median DOM | 8 days | List date to offer acceptance |
| Median sale-to-list | 104% | Typical small premium over list |
Together these four numbers point to one read: Q1 remains a structurally tight seller's market. A median DOM of 8 days means a properly-priced listing is typically under contract within a week; a 4% median premium means buyers are still willing to bid above ask in mainstream price tiers. But region-wide averages mask substantial city- and tier-level differentiation. The remainder of this report unpacks that.
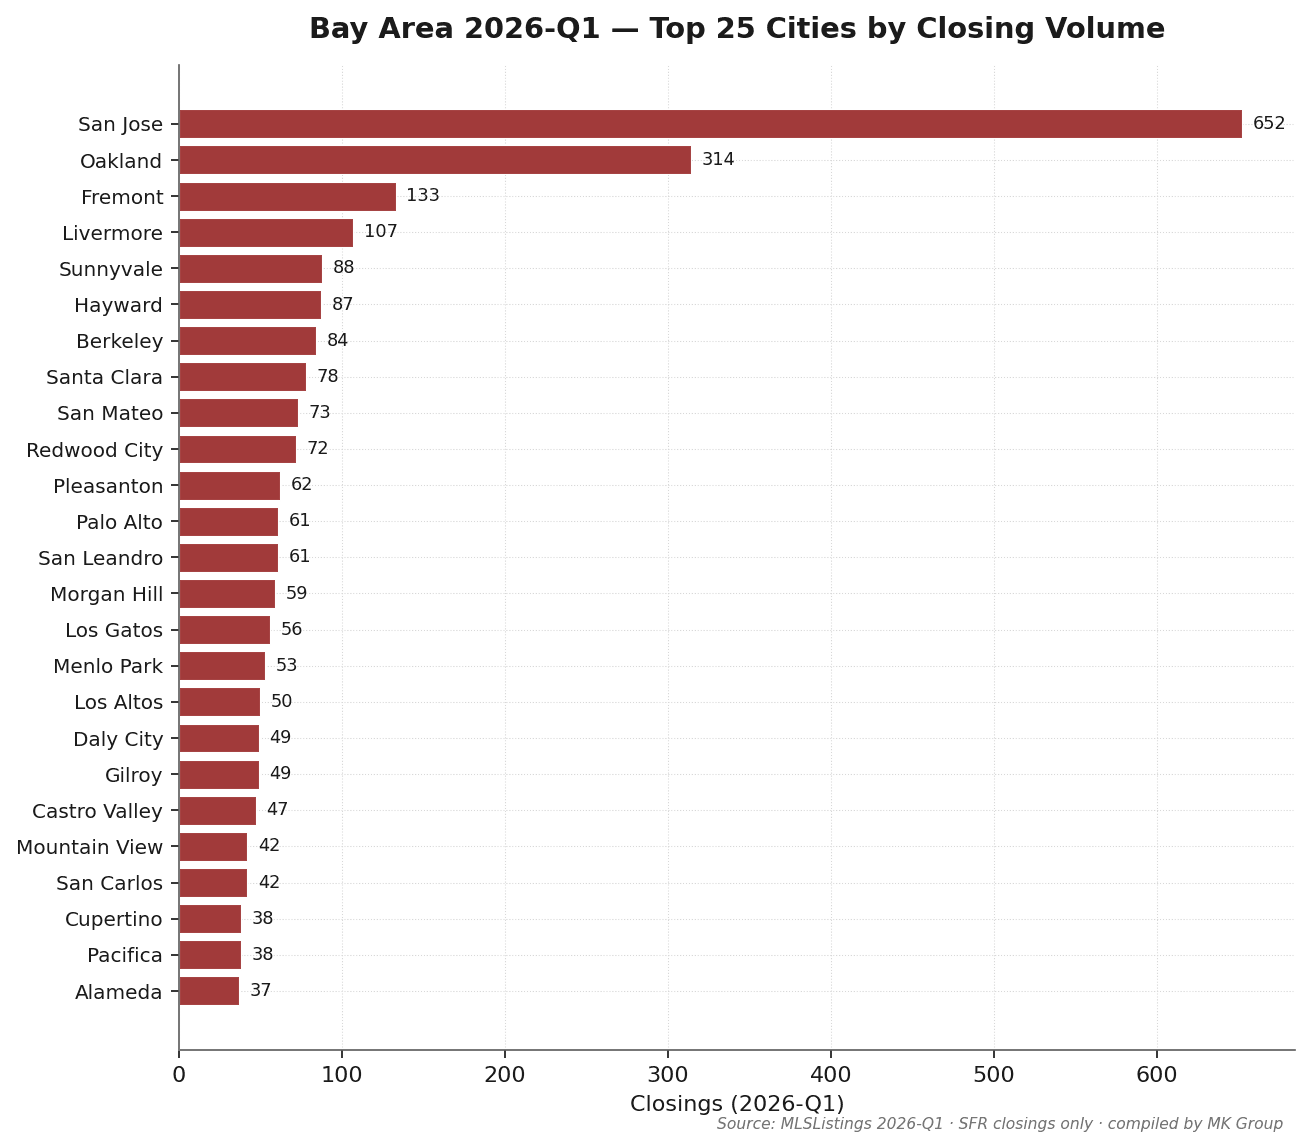
San Jose recorded 652 Q1 closings — 22% of the regional total. Oakland (314) and Fremont (133) follow. Among MK Group's core service cities: Palo Alto 61, Menlo Park 53, Los Altos 50, Cupertino 38 — low volume but high price.
Source: MLSListings Q1 2026 SFR closings · excludes condo, multi-family, and records with sale price below $100K.
3. YoY Comparison vs Q1 2025: 12-Month Longitudinal Validation
The Q1 2025 dataset was formally archived on 2026-05-20, enabling the first true longitudinal comparison for this report series. A single-quarter snapshot can only describe what happened now; a 12-month YoY delta answers whether this is structural or seasonal noise. The Q1 2026 vs Q1 2025 comparison gives a clear answer: luxury credit decoupling is not a snapshot artifact — it deepened over a full market cycle. Mortgage rates fell 72 bps, yet the $10M-$20M all-cash share rose 9.8pp. That combination is anomalous under standard macro frameworks and fully coherent under the three-pool capital model (AI/IPO liquidity, cross-border family-office capital, local generational wealth).
| Indicator | Q1 2025 | Q1 2026 | YoY Change |
|---|---|---|---|
| 30-yr fixed mortgage avg | 6.83% | 6.11% | −72 bps |
| S&P 500 quarter return | −4.59% | −4.63% | 相近 |
| Case-Shiller SF HPI YoY | +1.53% | +1.03% | 放缓但正增长 |
| Total in-quarter closings | 2,902 | 2,986 | +2.9% |
| $10M–$20M cash share | 76.9% | 86.7% | +9.8 pp |
| $5M–$10M cash share | 53.9% | 53.7% | −0.2 pp |
| $3M–$5M cash share | 23.6% | 29.1% | +5.5 pp |
| $1.5M–$3M cash share | 18.2% | 20.1% | +1.9 pp |
| $20M+ closings | 2 | 6 | 3× |
| $20M+ median DOM | 144 天 | 9 天 | −135 天 |
| $20M+ median sale/orig | 90.7% | ~100% | +10 pp |
| $10M+ total closings | 15 | 21 | +40% |
Sources: MLSListings Q1 2025 (archived 2026-05-20) & Q1 2026 · Cash transaction definition aligned across both periods (Buyer Financing = "All Cash No Loans" or "Cash to Existing Loan")
1. Rate transmission failure: Mortgage rates fell 72 bps YoY — theoretically stimulating mortgage-financed buyers to re-enter luxury. Instead, $10M-$20M cash share rose from 76.9% to 86.7% (+9.8pp). Lower rates didn't pull mortgage buyers back into this tier; they pushed mid-tier capital further up the price ladder. This is 12-month longitudinal confirmation of luxury credit decoupling.
2. $20M+ character flip: The same band shifted from seller-concession clearance (2025: 144-day median DOM, 90.7% sale/orig, 2 closings) to list-tight competition (2026: 9-day median DOM, ~100% sale/orig, 6 closings) within 12 months. Not gradual evolution — a character flip within one annual cycle.
3. K-split becomes structural: $10M+ closings rose 40% YoY (15 → 21) while total volume rose only 2.9% (2,902 → 2,986). Luxury grew at 14× the rate of the overall market. A divergence of this magnitude means the Bay Area is no longer a single market — it is two market logics operating inside the same geographic boundary.
4. The Cash Ladder: Luxury's Decoupling from Credit
| Indicator | This Quarter | vs Prior Q | YoY |
|---|---|---|---|
| 30-yr fixed mortgage avg | 6.11% | −0.12 pp | −0.72 pp |
| 15-yr fixed mortgage avg | 5.48% | −0.01 pp | −0.54 pp |
| 10-yr Treasury yield avg | 4.20% | +0.10 pp | −0.26 pp |
| CA unemployment rate | 5.40% | −0.13 pp | −0.03 pp |
| S&P 500 close (period-end) | 6,528.5 | −4.63% | +16.33% |
| Case-Shiller SF HPI | 361.6 | +0.12% | +1.03% |
Sources: Freddie Mac PMMS / U.S. Treasury / BLS / S&P Global / S&P CoreLogic (via FRED API) · fetched 2026-05-16
This is the most important data cluster in this issue. Q1 macro backdrop: 30-yr mortgage rate 72 bps below a year ago, S&P 500 down 4.6% in the quarter, Case-Shiller SF HPI +1% year-over-year. In an environment of cheaper credit, lower equity wealth, and flat prices, the behavior of the luxury tier is genuinely anomalous.
| Price Band | Closings | Cash % | Median Sale | DOM |
|---|---|---|---|---|
| <$1M | 459 | 19.6% | $800K | 13 |
| $1M–$1.5M | 736 | 16.8% | $1.28M | 11 |
| $1.5M–$3M | 1,272 | 20.1% | $1.98M | 8 |
| $3M–$5M | 375 | 29.1% | $3.60M | 8 |
| $5M–$10M | 123 | 53.7% | $6.13M | 8 |
| $10M–$20M | 15 | 86.7% | $11.75M | 7 |
| $20M+ | 6 | 100.0% | $23.7M | 9 |
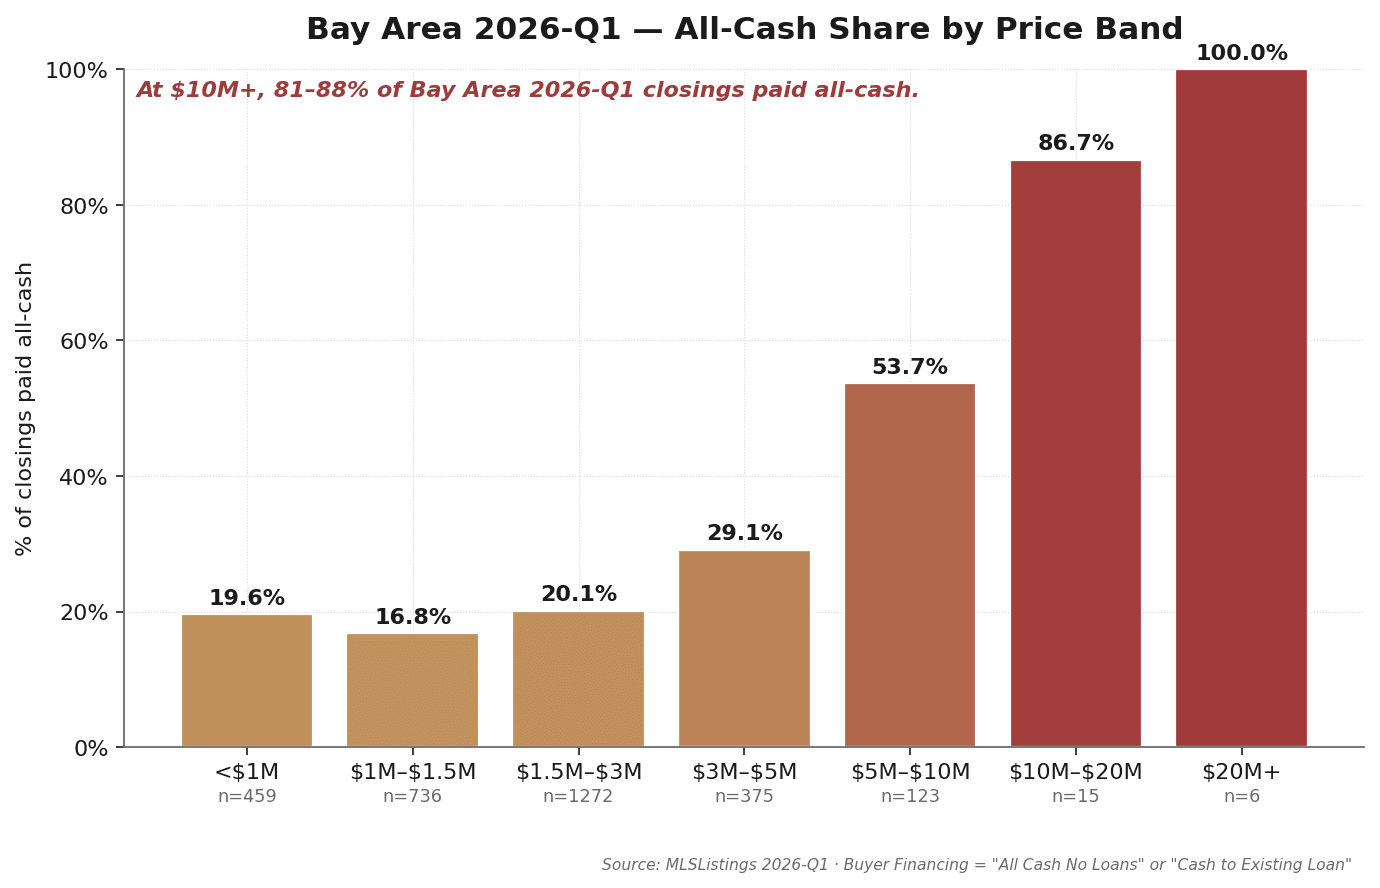
YoY note: $10M–$20M all-cash share rose from 76.9% (Q1 2025) to 86.7% (Q1 2026), a +9.8pp YoY increase — see Section 3 for longitudinal context.
Observation 1: Cash share is a phase transition, not a gradual trend
From 20% in the $1.5M–$3M tier to 54% at $5M–$10M and 87% at $10M+ — this is not a smooth curve. It is a phase transition at the $5M threshold. Below $5M: dual-income tech households on jumbo loans. Above $5M: AI/IPO liquidity, cross-border family office capital, and generational wealth — none of which depend on mortgage rates.
Observation 2: The $10M+ tier has effectively decoupled from credit markets
When 87% of transactions require no mortgage, rate moves have negligible impact on volume or pricing. The 30-yr rate fell 72 bps year-over-year in Q1 2026. If credit cost were the binding constraint, that should have boosted activity. Instead: $10M+ produced only 15 closings and a sale-to-original ratio of 100.2%. Zero observable rate-driven response. That is the decoupling in evidence form.
Observation 3: Three independent capital pools
- AI/IPO secondary liquidity — OpenAI tender, Databricks $100B+ valuation, xAI/Anthropic secondary markets — these created large pockets of liquid wealth for Bay Area tech executives and early employees over the past 12 months.
- Cross-border family office capital — primarily from China, East Asia, and India, held through trust/LLC structures, completely outside U.S. credit markets.
- Local generational wealth transfer — Bay Area families who bought in the 1980s–2000s are passing assets through Living Trust + step-up basis structures; the next generation converts to cash equity rather than home equity loans.
Source: MLSListings Q1 2026 · "Buyer Financing" field = "All Cash No Loans" or "Cash to Existing Loan" classified as cash · field completeness 99.1%
5. Mid-Tier Squeeze: The $3M–$5M Segment
If the luxury story is decoupling, the mid-tier story is compression.
The data
$3M–$5M: 375 closings, median sale-to-original-list 106.8% — the highest of any band. $1.5M–$3M follows at 106.6%. These two bands together (1,647 closings, 55% of Q1 total) show that the Bay Area's volume engine typically closes at 4–7% above original list. By contrast: $10M+ median sale/original is 100.0–100.2% — essentially at ask, almost no bidding war.
Why the mid-tier is the most contested
$3M–$5M is the entry threshold for Bay Area GreatSchools 10/10 districts — Palo Alto Unified (most ZIP codes), Cupertino Union core ZIPs, Los Altos/Saratoga mid-tier — all concentrated in this range. The buyer profile is remarkably homogeneous: age 30–45, FAANG/AI mid-manager or senior engineer, RSU/pre-IPO equity but limited liquid cash, kids in elementary or middle school with hard school-zone requirements. On the supply side, existing owners typically locked in at 2.5–3.5% in 2018–2022; trading up means nearly doubling their mortgage rate. That rate-lock effect is strongest precisely here.
Source: MLSListings Q1 2026 · Sale Price ÷ Original List Price · median (not mean)
6. $20M+ Ultra-Luxury: Six Transactions, Decoded
YoY note: Q1 2025 saw only 2 $20M+ closings with median DOM 144 days and median sale/orig 90.7% — seller-concession territory. Q1 2026's 6 closings at median DOM 9 days and ~100% sale/orig represent a character flip within a single annual cycle. See Section 3 for full longitudinal data.
The entire Bay Area produced 6 public MLS closings above $20M in Q1 2026. That number is itself a data point.
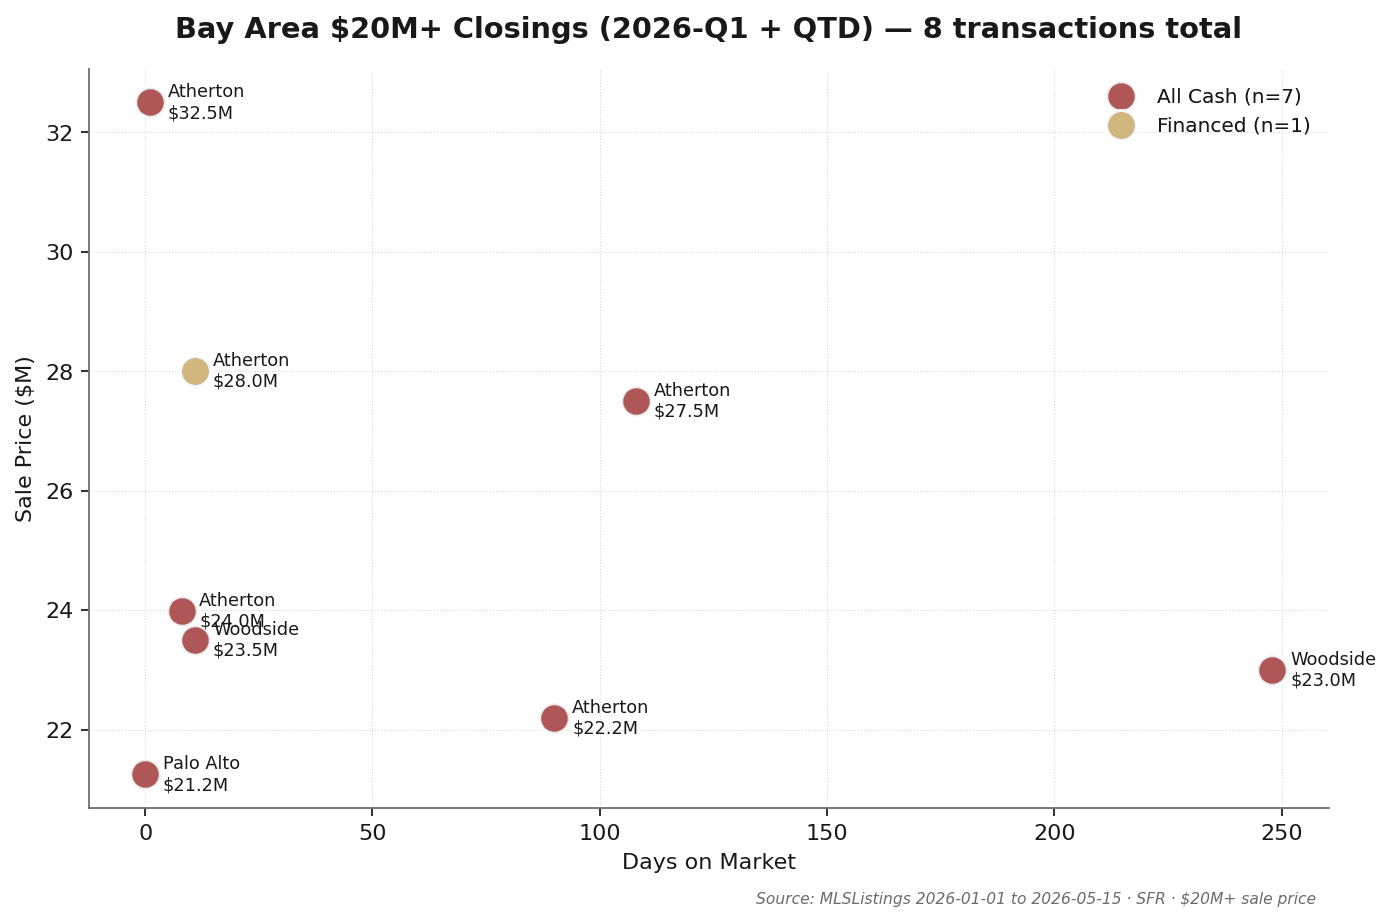
Transaction detail (Q1 + QTD through May 15 · 8 total)
| City | Address | Sale Price | Orig List | DOM | Cash | Close Date |
|---|---|---|---|---|---|---|
| Atherton | 190 Almendral Ave | $32.5M | $32.0M | 1 | ✓ | 2026-03-30 |
| Atherton | 2 Somerset Ln | $28.0M | $26.5M | 11 | — | 2026-05-12 * |
| Atherton | 54 Barry Ln | $27.5M | $27.5M | 108 | ✓ | 2026-02-24 |
| Atherton | 35 Barry Ln | $24.0M | $24.0M | 8 | ✓ | 2026-03-25 |
| Woodside | 6 Cedar Ln | $23.5M | $23.5M | 11 | ✓ | 2026-02-06 |
| Woodside | 211 Winding Way | $23.0M | $25.0M | 248 | ✓ | 2026-04-09 * |
| Atherton | 291 Atherton Ave | $22.2M | $23.9M | 90 | ✓ | 2026-01-22 |
| Palo Alto | 1700 Waverley St | $21.3M | $26.0M | 0 | ✓ | 2026-02-09 |
* Marked as QTD (Q2 closing, 4/1–5/15)
Three observations
1. Six closings confirms genuine scarcity. Atherton accounts for 5 of 8 (including QTD), Woodside 2, Palo Alto 1 — ultra-luxury is highly geographically concentrated.
2. DOM is bimodal. Four closings at DOM ≤ 11 (effectively instant); three closings at DOM 90+. Ultra-luxury is either immediate or long-term stale — the middle outcome barely exists.
3. 87.5% cash. Only one of eight used financing. This is a purely relationship-driven market; conventional buyer's agents and loan officers play almost no role. Off-market share is likely even higher: these 8 are public MLS records; true $20M+ volume would include pocket listings not on MLS.
7. City Tiers: Six Groups, Six Narratives
Plotting Q1 data on a city scatter (median price × cash share × volume), the Bay Area resolves into six distinct city clusters.
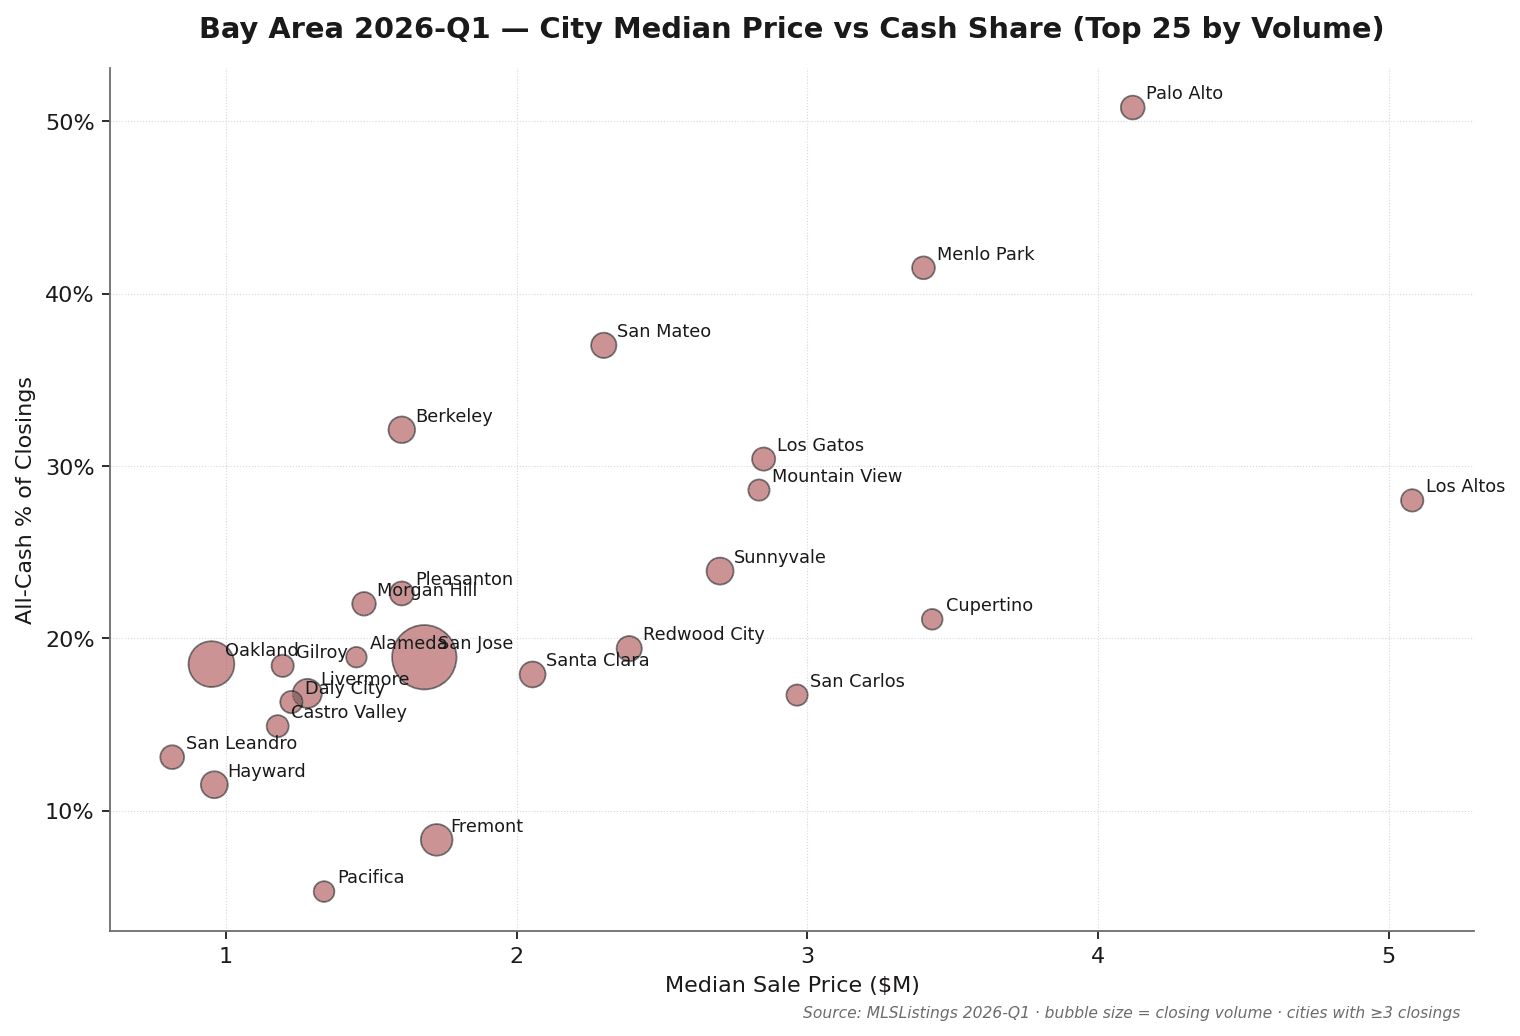
Tier 1 · Ultra-Luxury Anchor (Atherton / Hillsborough / Woodside / Los Altos Hills)
Median sale price $5M+, all-cash share 50%+, very low volume (fewer than 30 public closings per city per quarter). Off-market share is substantial; MLS data meaningfully understates true activity in Atherton and similar markets.
Tier 2 · Premium School-District Core (Palo Alto / Los Altos / Cupertino / Menlo Park)
Median $3M–$5M, 30–50% all-cash, strong seller's market (sale/list 105%+). The most contested school-district segment. Palo Alto: 61 closings, median $4.12M, 51% cash.
Tier 3 · Tech Corridor Core (Sunnyvale / Mountain View / Santa Clara)
Median $2M–$2.7M, high FAANG/AI employee concentration, sale/list 105–110%. Sunnyvale: 88 closings, median $2.7M, sale/original 109.8% — the sweet spot for mid-career tech buyers.
Tier 4 · Mainstream Housing Market (San Jose / Fremont / San Mateo / Redwood City)
The volume engine of the Bay Area market. San Jose: 652 closings (22% of regional total), median $1.68M, 19% cash. Sale/list typically 103–106%, DOM 8–13 days.
Tier 5 · East Bay Expansion (Oakland / Berkeley / Hayward / Pleasanton / Livermore)
Widest internal spread. Berkeley: median $1.6M, sale/original 122% (region high). Oakland: median $950K, 314 closings (No.2 by volume). Pleasanton: median $1.6M but sale/original 100% — East Bay is effectively its own segmented market.
Tier 6 · Coastal / Outer Suburbs (Pacifica / Half Moon Bay / Gilroy / Morgan Hill)
Median $1M–$1.5M, DOM 10–15 days (noticeably slower than core), cash share under 10%. Most mortgage-dependent segment; most rate-sensitive of the six tiers.
City data (20 representative cities)
| City | Count | Median Sale | Cash % | DOM | Sale/Orig % |
|---|---|---|---|---|---|
| San Jose | 652 | $1.68M | 18.9% | 8 | 104.7% |
| Oakland | 314 | $950K | 18.5% | 13 | 109.0% |
| Fremont | 133 | $1.73M | 8.3% | 8 | 104.9% |
| Livermore | 107 | $1.28M | 16.8% | 8 | 101.6% |
| Sunnyvale | 88 | $2.70M | 23.9% | 8 | 109.8% |
| Hayward | 87 | $960K | 11.5% | 11 | 101.9% |
| Berkeley | 84 | $1.61M | 32.1% | 14 | 122.2% |
| Santa Clara | 78 | $2.06M | 17.9% | 8 | 107.4% |
| San Mateo | 73 | $2.30M | 37.0% | 7 | 110.8% |
| Redwood City | 72 | $2.39M | 19.4% | 9 | 105.6% |
| Palo Alto | 61 | $4.12M | 50.8% | 8 | 106.7% |
| Menlo Park | 53 | $3.40M | 41.5% | 7 | 109.1% |
| Los Altos | 50 | $5.08M | 28.0% | 8 | 104.4% |
| Mountain View | 42 | $2.83M | 28.6% | 7 | 110.3% |
| Cupertino | 38 | $3.43M | 21.1% | 7 | 109.3% |
| Burlingame | 36 | $3.21M | 38.9% | 9 | 107.9% |
| Saratoga | 35 | $4.21M | 37.1% | 7 | 105.4% |
| Los Gatos | 56 | $2.85M | 30.4% | 8 | 103.8% |
| San Carlos | 42 | $2.97M | 16.7% | 8 | 103.1% |
| Pleasanton | 62 | $1.61M | 22.6% | 8 | 100.0% |
Source: MLSListings Q1 2026 · cities with 3+ closings in quarter (52 cities ranked)
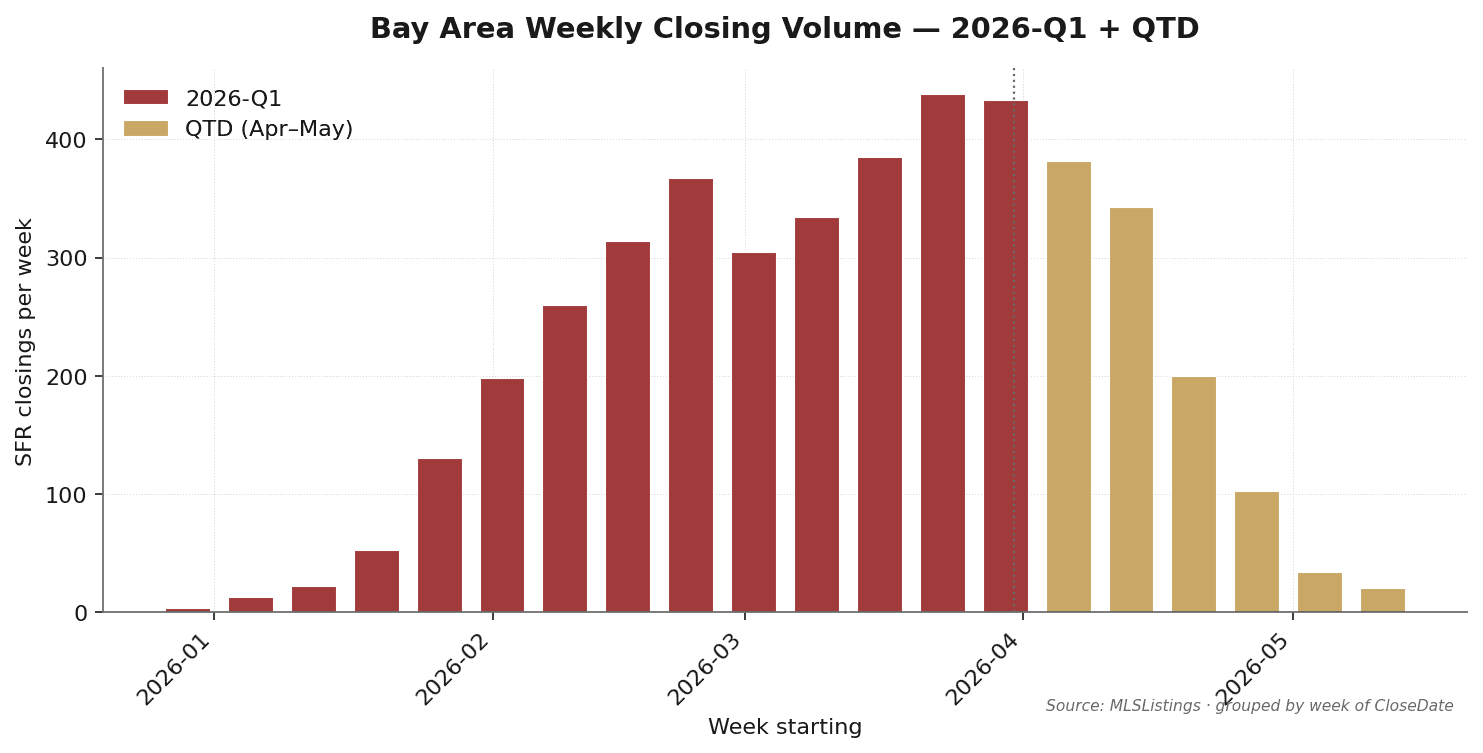
8. Q2 Early Signals (QTD: April 1 – May 15)
As of the report date (2026-05-15), Q2 has accumulated 1,354 closings — roughly half a full quarter. This data is used to assess whether Q1 dynamics are carrying into Q2.
Three comparative reads
Cash share: essentially flat. QTD all-segment cash share ~23% vs Q1 21% — within statistical noise. $5M+ cash share QTD holds at 55–85% — Q1 luxury decoupling pattern carries forward.
DOM: slightly extended. QTD median DOM 9 days vs Q1 median 8 — a mild but visible softening signal, likely reflecting expanding spring supply.
Sale/list: holds at highs. QTD median sale/list 104%, matching Q1. The $3M–$5M mid-tier squeeze continues at sale/original 105%+ — no relief in Q2 early data.
Q2 full-quarter outlook
- Q2 full-quarter volume expected at 2,700–3,100 closings (comparable to Q1 or slightly lower due to April rate headwinds).
- Luxury ($5M+) cash-dominant pattern continues; Q2 $10M+ cash share projected 80%+; $20M+ still near 100%.
- Mid-tier $3M–$5M squeeze likely persists at least through Q3 early — rate-lock supply constraint has no near-term resolution.
The next Pulse report (Q2 2026) will confirm or revise these early signals. Expected publication: 2026-08-15.
9. Takeaways for Sellers, Buyers, and Cross-Border Investors
For sellers
- Mid-tier ($1.5M–$5M) remains a strong seller's market; price at market and expect a premium. Median sale/original is 106%+ — pricing at ask typically closes at 4–7% above. Do not list low to generate bidding wars; Q1 data shows that strategy consistently underperforms.
- $5M+ requires 8–10 weeks of pre-listing preparation and active evaluation of off-market private channels. Luxury closes fast (median DOM 7–9 days), which means all preparation must precede the listing date. Buyer pools at this tier are heavily relationship-driven; public MLS alone is not the optimal reach strategy.
- Do not let the "wait for rates" narrative delay decisions. Q1 data shows clearly: $3M+ buyers are not rate-sensitive — cash share is already 30%+, and mortgage rates are not the primary decision variable.
For buyers
- Mid-tier ($3M–$5M): plan for 5–10% above list, and prioritize all-cash or fast-close capability. These advantages outperform incrementally higher bids at ask price.
- Luxury ($5M+): your real resource is off-market relationships, not MLS scanning. $10M+ generated only 21 public closings (including QTD). True volume is much higher. Two or three first-tier agent relationships are worth more than daily MLS alerts.
- School-zone buyers: the $3M–$5M band is the most contested; consider Tier 2 districts with a trade-up path. Cupertino, Los Altos, and parts of Sunnyvale offer better value efficiency; a 5–7 year trade-up window may be easier on household finances than fighting for Palo Alto core today.
For cross-border investors
- All-cash advantage is more differentiated at $5M+ than at $3M. At $5M–$10M, 54% of buyers are already cash — you are level with half the competition. At $3M, only 25% are cash — scarcity premium is smaller.
- Establish trust/LLC holding structure before the offer stage. FIRPTA withholding (15% for foreign sellers), estate tax exposure, and FinCEN BOI filing requirements are all costly to restructure post-signing.
- Cross-border buyer flow into $5M+ remains active in Q1 2026. MK Group's direct observations confirm high-net-worth buyers from China, East Asia, and India are active, with relatively mature compliance pathways (lawful exchange + third-party offshore routing + U.S. escrow settlement).
⚠️ Tax and legal content in this section is for general informational purposes only and does not constitute professional advice. Consult a qualified tax attorney or CPA for your specific situation.
10. Methodology & Definitions
Data source
Core data sourced from MLSListings (the primary Bay Area MLS, covering Santa Clara, San Mateo, Santa Cruz, and Monterey counties, with regional agreements extending coverage to Alameda, Contra Costa, San Francisco, Marin, and Solano). The $20M+ tier was individually verified by Marie Wang and Kevin Mo against public closing records.
Time windows
- Q1 primary data: CloseDate [2026-01-01, 2026-03-31], 2,986 records
- QTD supplement: CloseDate [2026-04-01, 2026-05-15], 1,354 records
Property type
Single Family Residential (SFR) only. Condos, multi-family, and land excluded.
All-cash definition
MLSListings "Buyer Financing" field value of "All Cash No Loans" or "Cash to Existing Loan" classified as cash. All other values (Conventional, FHA, VA, Private, etc.) classified as financed. Field completeness: 99.1% in this dataset.
Price band classification
Based on Sale Price (actual close price), not List Price. All medians are statistical medians, not means.
Exclusions
- Status = Cancelled / Expired / Withdrawn: excluded
- Sale Price < $100,000: excluded (likely family/trust/divorce transfers)
Known limitations
- Off-market transactions not on MLS are excluded. Industry estimates suggest $5M+ off-market volume adds 15–25% on top of public MLS counts. The 6-transaction $20M+ figure reflects only public closings.
- YoY comparison added in the 2026-05-20 update — Q1 2025 data formally archived and field definitions aligned across both periods. See Section 3 for full longitudinal context.
- School-zone-level breakdowns not included in this issue; planned as a new chapter in Q2 2026.
11. About MK Group
MK Group (Meridian Keystone Real Estate Group) is a Bay Area real estate team based in Cupertino, co-founded by Marie Wang (DRE# 02110980) and Kevin Mo (DRE# 02127623), operating with Keller Williams Realty.
The team focuses on the $3M–$30M+ buy and sell market across the SF Peninsula and South Bay, with deep specialization in cross-border buyer advisory. MK Group is one of the few Bay Area teams with both deep English-language market fluency and native Chinese-language service capability — 68K+ combined YouTube subscribers (@MarieWang 44K+ / @KevinMoRE 24K+), plus Xiaohongshu and WeChat reach.
About the MK Bay Area Pulse Series
Pulse is a quarterly market intelligence report grounded in complete MLS closing data, County Recorder cross-reference, and direct transaction observations from 200+ client engagements. It is designed to serve buyers, sellers, investors, media, and researchers who need data-driven, source-transparent, cross-tier Bay Area market analysis.
Citation
Please cite as: "MK Bay Area Pulse 2026-Q1, MK Group"
For high-resolution charts, full dataset, or press inquiries, contact Marie Wang(marie.wang@kw.com) or Kevin Mo(kevin.mo@kw.com), or via mkbayarea.com/contact
Next issue
Q2 2026 Pulse Report expected 2026-08-15. New chapters: school-zone-level pricing analysis and cross-border buyer flow tracking.
Questions about your specific situation?
Data provides context — your decision depends on your timeline, budget, and goals. Reach out to Marie Wang or Kevin Mo directly. First consultation is always free and carries no obligation.