This Pulse issue analyzes 5,941 SFR closings across the Bay Area in Q2 2026 (57 cities, 3 counties), with a hard year-over-year comparison against the archived Q2 2025 baseline. Three headline findings: $10M+ closings rose 62% YoY (29 → 47) against 3.5% total-market growth — the K-shaped split confirmed at scale — while financed luxury deals rose from 2 to 13 as leverage returned; $20M+ logged 8 closings at 44-day median DOM and 91.5% of original list, back to a negotiating market yet bimodal (three sold 5.7%, 10.0% and 17.8% over list); and $3M–$5M held the highest sale-to-original ratio of any band (105.3%) for a second straight quarter. Sourced from MLSListings and FRED, with full methodology transparency.
Scroll the PDF for the full report; the web version below adds clickable links and embedded charts.
- $10M+ closings hit 47, up 62% YoY (29 → 47), while total volume rose only 3.5% — the K-shaped split keeps widening; but cash share receded from 92.6% in Q1 to 72.3%, and financed deals rose from 2 in Q1 to 13 in Q2.
- Eight $20M+ closings (six in Atherton), median DOM 44 days, median sale at 91.5% of original list — back to a negotiating market; the quarter’s largest sale (Atherton, $28.0M) was financed and closed 5.7% over original list.
- The $3M–$5M band logged 822 closings (+84% quarter-over-quarter) at a 105.3% median sale-to-original-list ratio — the highest band for a second straight quarter, with 8-day median DOM: the spring supply surge did not relieve the school-district middle.
1. The 30-Second Read
This issue draws on 5,941 single-family residence (SFR) closings in the Bay Area during Q2 2026 (CloseDate April 1 through June 30), spanning 3 core counties and 57 cities, sourced from MLSListings. Starting with this issue, Pulse covers in-quarter data only — no QTD supplement and no forward projections.
- Q2 SFR median sale price $1.73M (+0.9% YoY), median days on market 12 (flat vs a year ago), median sale-to-list ratio 103.3% — the seller's market holds, at a gentler pace than Q1's 8-day sprint.
- All-cash share still climbs the price ladder: 15–16% below $3M, 44.4% at $5M–$10M, 71.8% at $10M–$20M, 75.0% at $20M+ — the ladder stands, but the top is visibly softer than Q1's 89.5% / 100%.
- The most competitive band is $3M–$5M for the second consecutive quarter: median sale-to-original-list 105.3%, median DOM 8 days.
- Only 8 transactions over $20M closed in Q2, six of them in Atherton. Median DOM 44 days, median sale at 91.5% of original list — ultra-luxury is back to negotiating.
- Palo Alto Q2: 139 closings (+8% YoY), median $4.10M (+11.4% YoY), 36% cash.
- $10M+ recorded 47 closings — a series high — including 13 financed deals versus 2 last quarter. Leverage is back in the luxury tier.
Source: MLSListings Q2 2026 SFR closings (April 1 – June 30) · MK Group · Field definitions in Section 9.
2. Bay Area Fundamentals: Four Baseline Numbers
The Q2 2026 Bay Area SFR market is summarized most accurately by four numbers:
| Metric | Q2 2026 Median | Interpretation |
|---|---|---|
| Total closings | 5,941 | 3 core counties, 57 cities; +3.5% YoY |
| Median sale price | $1.73M | All bands aggregated; +0.9% YoY |
| Median DOM | 12 days | List date to offer acceptance; flat YoY |
| Median sale-to-list | 103.3% | Typical small premium over list |
Together these numbers point to one read: Q2 remains a seller's market, and the spring surge is real growth rather than a seasonal illusion — 5,941 closings ran 3.5% ahead of Q2 2025, with median price up alongside. Median DOM moved from Q1's 8 days back to 12 — exactly matching Q2 2025. Q1's 8-day pace reflected winter scarcity, not further acceleration. But region-wide averages mask substantial city- and band-level differentiation. The remainder of this report unpacks that.
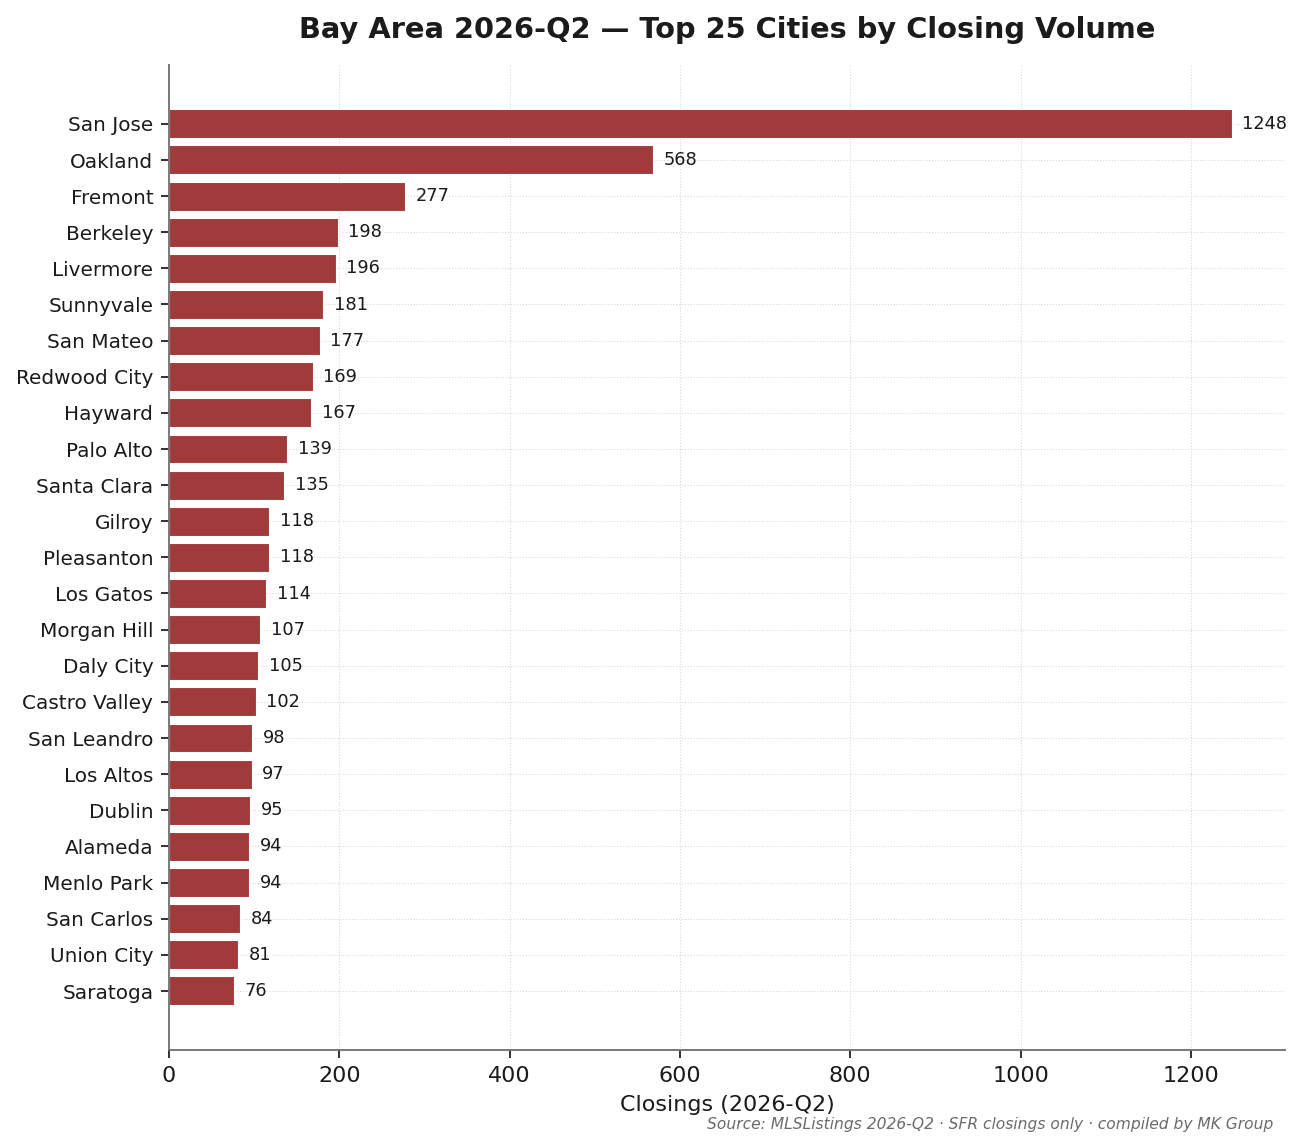
San Jose recorded 1,248 Q2 closings — 20.8% of the regional total. Oakland (568) and Fremont (277) follow. Among MK Group's core service cities: Palo Alto 139, Menlo Park 94, Los Altos 97, Cupertino 60 — low volume but high price.
Source: MLSListings Q2 2026 SFR closings · excludes condo, multi-family, and records with sale price below $100K.
3. YoY Comparison vs Q2 2025: Structural Change Inside a Volume Expansion
This is the second Pulse issue with a full year-over-year comparison — the Q2 2025 baseline is archived, and same-quarter-to-same-quarter comparison neutralizes seasonality by construction. The Q2 2026 vs Q2 2025 story differs from last issue's: luxury is expanding in volume while its pricing power normalizes. $10M+ closings jumped from 29 to 47 (+62%) against total-market growth of just 3.5% — an even stronger K-shape reading than Q1's (+50% vs +1.3%). But arriving with that volume: the first YoY decline in top-band cash share in this series, and a return of financed deals.
| Indicator | Q2 2025 | Q2 2026 | YoY Change |
|---|---|---|---|
| 30-yr fixed mortgage avg | 6.79% | 6.41% | −0.37 pp |
| S&P 500 quarter return | +10.57% | +14.87% | two strong quarters |
| Case-Shiller SF HPI YoY | −2.10% | +2.47% | negative → positive |
| Total in-quarter closings | 5,738 | 5,941 | +3.5% |
| Median sale price | $1.71M | $1.73M | +0.9% |
| $10M+ total closings | 29 | 47 | +62% |
| $10M–$20M cash share | 80.0% | 71.8% | −8.2 pp |
| $5M–$10M cash share | 43.0% | 44.4% | +1.4 pp |
| $3M–$5M cash share | 22.2% | 26.8% | +4.6 pp |
| $1.5M–$3M cash share | 14.3% | 15.7% | +1.4 pp |
| $20M+ closings | 4 | 8 | 2× |
| $20M+ median DOM | 57 days | 44 days | −13 days |
| $20M+ median sale/orig | 86.6% | 91.5% | +4.9 pp |
Sources: MLSListings Q2 2025 (archived) & Q2 2026 · Cash definition aligned across both periods (Buyer Financing = "All Cash No Loans" or "Cash to Existing Loan") · Rate change computed on unrounded weekly averages · Both years' $20M+ samples are under 10 transactions; interpret ratios with caution.
1. The K-shape confirmed at scale: $10M+ closings rose 62% YoY (29 → 47) while total volume rose 3.5% — luxury grew at 18× the pace of the overall market. Last issue we called the K-shaped split a structural fact; Q2 reproduces the same structure on nearly double the sample. This no longer needs arguing — it is a quotable market fact.
2. First YoY decline in top-band cash share: $10M–$20M cash share fell from 80.0% to 71.8% (−8.2 pp) — the first year-over-year decline in this series' observation window. Direction matters more than magnitude: with $3M–$5M cash share up 4.2 pp over the same period, the cash ladder is converging toward the middle — flattening at both ends.
3. $20M+ recovered pricing power — partially: Q2 2025's $20M+ market was deep-discount clearance (median 86.6% of original list, 57-day DOM, 4 closings); Q2 2026 recovered to 91.5% / 44 days / 8 closings. Clear direction — yet a step back from Q1 2026's at-list, nine-day extreme. In eighteen months, ultra-luxury has cycled through three regimes: deep discount → frenzy → negotiation.
4. The Cash Ladder: Leverage Returns to Luxury
| Indicator | Quarter | vs Prev Q | YoY |
|---|---|---|---|
| 30-yr fixed mortgage avg | 6.41% | +0.31 pp | −0.37 pp |
| 15-yr fixed mortgage avg | 5.75% | +0.28 pp | −0.18 pp |
| 10-yr Treasury yield avg | 4.42% | +0.22 pp | +0.06 pp |
| CA unemployment rate | 5.30% | −0.07 pp | −0.17 pp |
| S&P 500 close (period-end) | 7,499.4 | +14.87% | +20.86% |
| Case-Shiller SF HPI | 358.9 | −0.12% | +2.47% |
Sources: Freddie Mac PMMS / U.S. Treasury / BLS / S&P Global / S&P CoreLogic — via FRED API · fetched 2026-07-10
First, the Q2 macro context (above): the 30-year fixed rate rose 31 bps within the quarter to 6.41% (still 37 bps below a year ago), the S&P 500 surged 14.9% in the quarter and 20.9% year-over-year, and the Case-Shiller SF index flipped from negative to positive YoY (+2.5%). This is the mirror image of Q1's "rates down, stocks down" — Q2 delivered rates up, stocks sharply up. How the luxury tier behaved under that combination is this issue's most important data.
| Price band | Closings | Cash % | Median sale | DOM |
|---|---|---|---|---|
| <$1M | 795 | 15.5% | $838K | 15 |
| $1M–$1.5M | 1,481 | 15.0% | $1.28M | 12 |
| $1.5M–$3M | 2,515 | 15.7% | $1.97M | 12 |
| $3M–$5M | 822 | 26.8% | $3.60M | 8 |
| $5M–$10M | 279 | 44.4% | $6.00M | 8 |
| $10M–$20M | 39 | 71.8% | $12.75M | 25 |
| $20M+ | 8 | 75.0% | $22.38M | 44 |
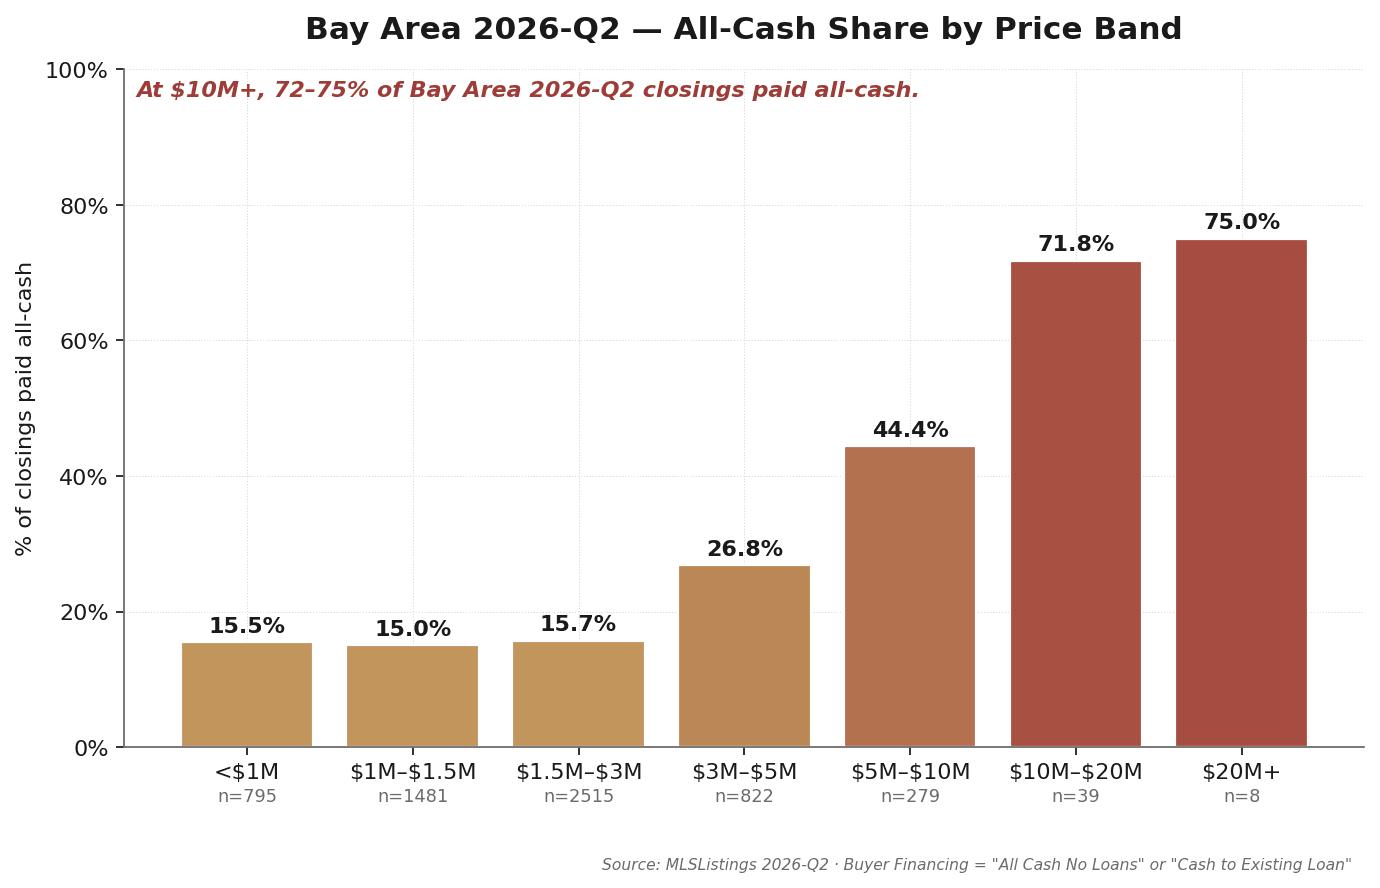
Observation 1: the ladder stands; the slope is flattening
From 16% in the $1.5M–$3M band to 44% at $5M–$10M and 71–75% at $10M+ — the stepwise structure is intact, and $5M remains the phase line in buyer capital structure. The movement is at the ends: the top ($10M–$20M) fell from 89.5% last quarter to 71.8%, while the mid-tier ($3M–$5M) rose 4.6 pp YoY. The ladder is converging toward its middle.
Observation 2: Q2's new variable is not vanishing cash — it is returning leverage
Of 47 $10M+ closings, 13 were financed — versus 2 last quarter. The financed share jumped from 7.4% to 27.7%. Equally notable, $5M–$10M: 155 of 279 closings financed (55.6%) — a majority of buyers in this band are using loans again (cash share 44.4% this quarter vs 48.9% in Q1, back to Q2 2025's 43.0% — Q1's cash majority looks like a pulse, not a new normal).
Observation 3: why a stock rally brings financing back
Intuitively, a 20.9% equity rally should leave wealthy buyers more cash-rich and push cash share higher. The opposite happened, and the mechanism is simple: in a fast-appreciating market, selling stock to buy a house gets expensive. When a portfolio compounds 20%+ a year, liquidating $15M for a home means exiting a compounding position and realizing capital gains tax now — while a 6.4% mortgage or a securities-backed credit line costs less than the expected portfolio return. In 2025 (flat equities, a Q1 correction), paying cash was the rational move; in Q2 2026, keeping the position and borrowing is. Luxury buyers did not get poorer — they got sharper about cost of capital.
Observation 4: an honest update to the "credit decoupling" thesis
Last issue we argued the luxury tier had decoupled from credit — mortgage rates do not drive $10M+ transaction behavior. Q2 stress-tested that thesis meaningfully: rates rose 31 bps within the quarter, and $10M+ volume rose anyway (29 → 47 YoY) — the half of the thesis that says rates do not constrain luxury volume holds. The half that says luxury does not use credit needs revision: when equity returns run far above borrowing costs, this tier opts into credit deliberately. The precise formulation: luxury's use of credit is opportunistic, not dependent — rates never decide whether they buy, only how they pay.
Source: MLSListings Q2 2026 · Buyer Financing field "All Cash No Loans" or "Cash to Existing Loan" classified as cash · field completion rate 99.2%.
5. The Mid-Tier Squeeze: $3M–$5M, Again
If the luxury story is returning leverage, the mid-tier story is still squeeze — for the second consecutive quarter.
The data
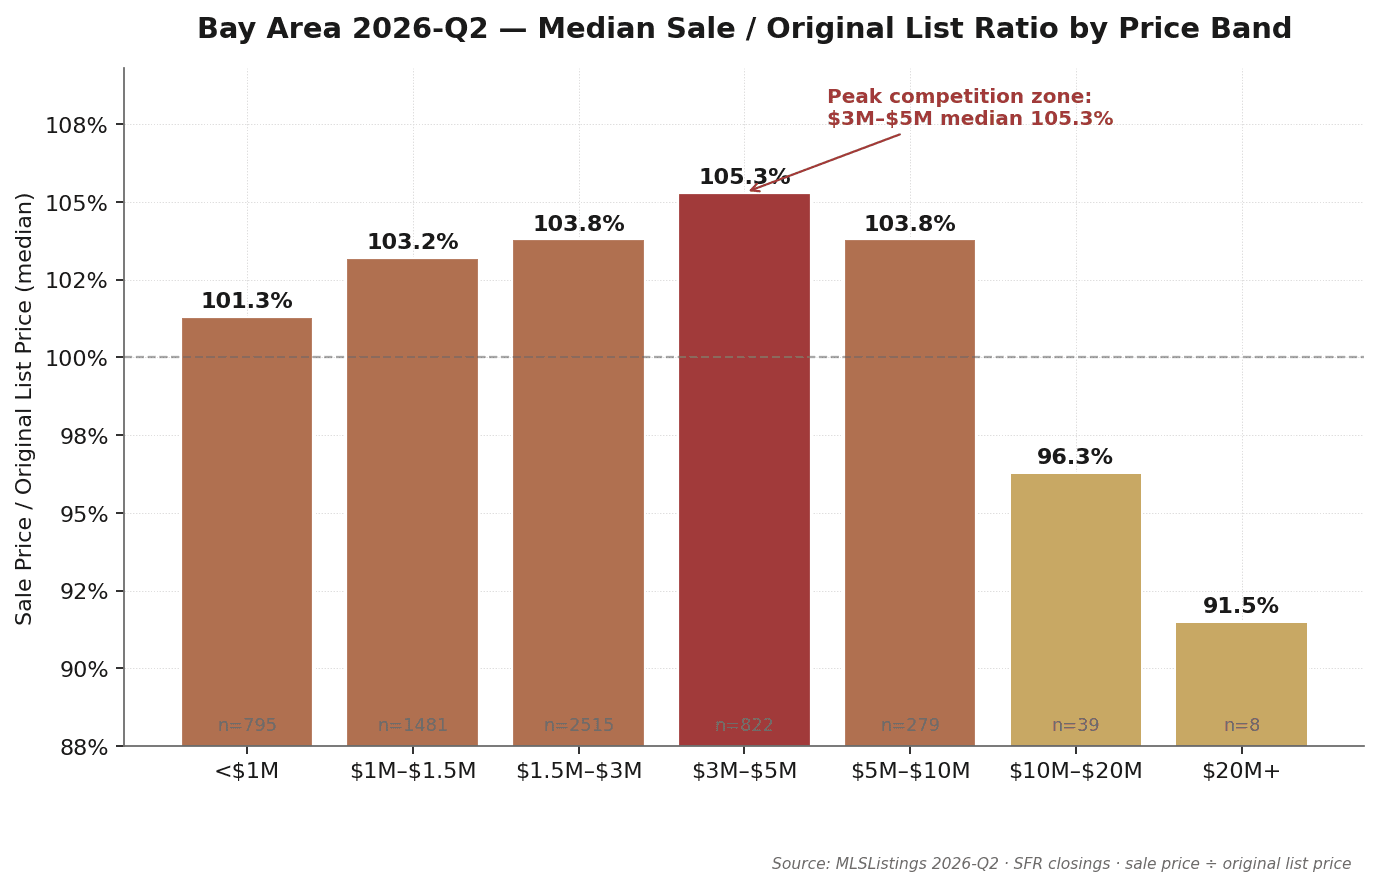
The $3M–$5M band recorded 822 Q2 closings (+84% QoQ, +10% YoY) at a median sale-to-original-list ratio of 105.3% — the highest of any band for the second quarter running — with median DOM of 8 days, tied with $5M–$10M for fastest. The $1.5M–$3M band follows at 103.8%. Together these two bands account for 3,337 transactions, 56% of Q2 volume — the Bay Area's mainstream market still routinely closes 4–5% above original list. By contrast: $10M–$20M closed at a median 96.3% of original list, and $20M+ at 91.5% — discounts reappeared at the top. Not in the mid-tier.
Why more supply did not loosen the squeeze
Supply expanded sharply in Q2 ($3M–$5M closings +84% QoQ), which should have cooled the bidding. It barely did — 106.0% → 105.3%, a 0.7-point easing that leaves the structure intact. The same two forces are at work. Demand expanded in step: $3M–$5M is the entry price for the Bay Area's strongest school zones (most Palo Alto Unified ZIPs, core Cupertino Union, mid-tier Los Altos and Saratoga), and the buyer profile is homogeneous — dual-income tech households aged 30–45, equity-rich but cash-constrained, with children in elementary or middle school; a 20.9% equity rally directly enlarged this cohort's down payments. The supply side's rate lock-in is unresolved: owners in this band largely locked 2.5–3.5% rates in 2018–2022; trading up at 6.4% still means roughly doubling the rate. Much of the spring volume came from non-discretionary sellers (estates, relocations) — the underlying reluctance of locked-in owners has not moved.
Why $5M+ behaves differently
The $5M–$10M band closed at a median 103.8% of original list — below $3M–$5M despite the higher price tag. Owners there have stronger move motivations (upgrades, empty nests, retirement) and far less rate sensitivity, so supply is comparatively healthy and bidding intensity lower.
Source: MLSListings Q2 2026 · Sale Price ÷ Original List Price, median (not mean).
6. $20M+ Ultra-Luxury: Eight Transactions, Two Speeds
Exactly eight SFR transactions above $20M closed across the Bay Area in Q2 2026 — even with Q1, and double Q2 2025's four. Six were in Atherton; one in Woodside and one in Old Palo Alto.
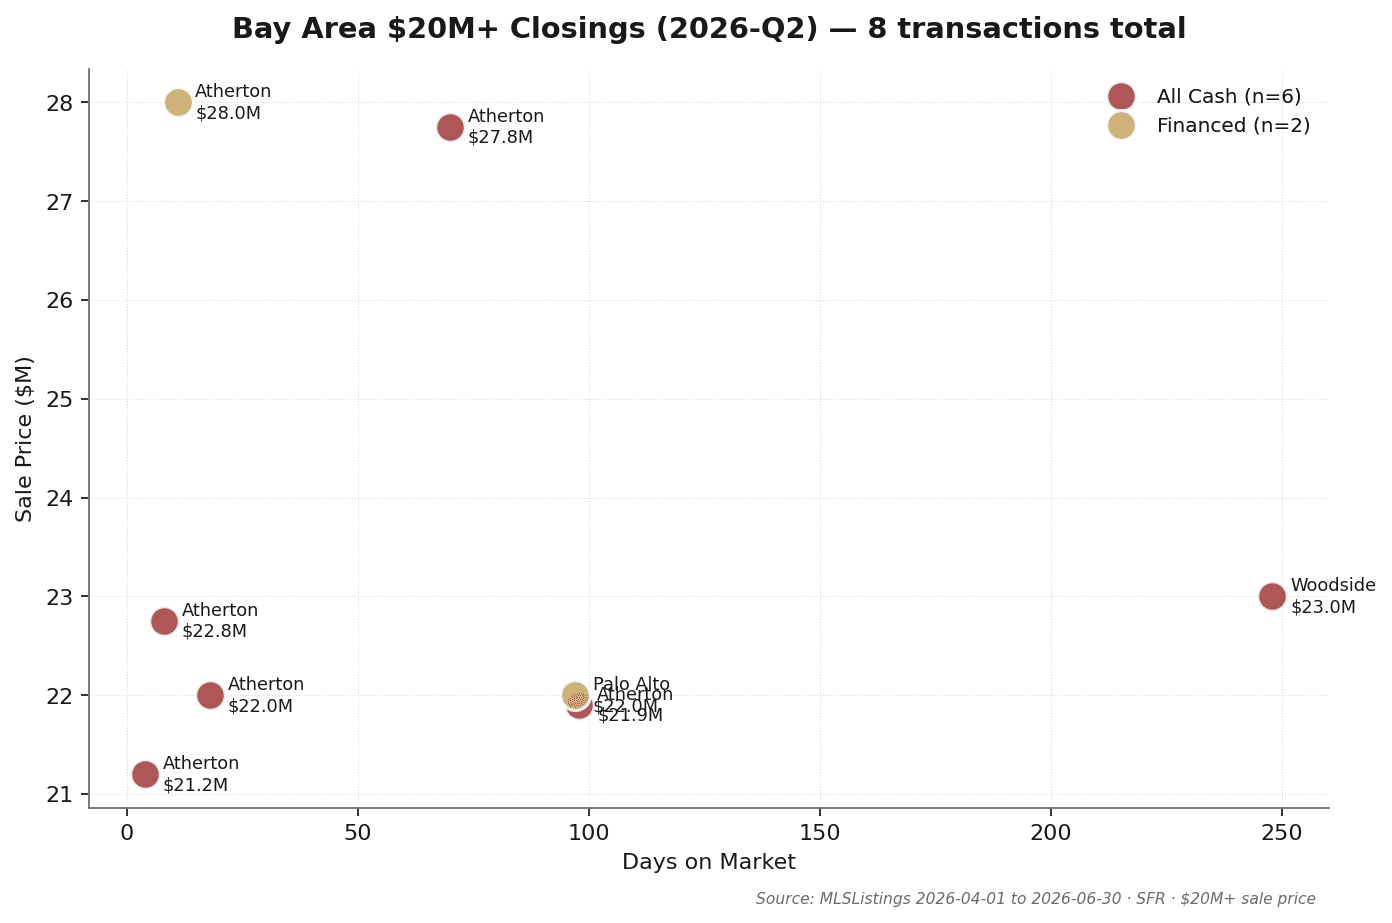
Transaction detail (in-quarter · 8 closings)
| City | Address | Sale | Orig List | DOM | Cash | Close |
|---|---|---|---|---|---|---|
| Atherton | 2 Somerset Ln | $28.00M | $26.50M | 11 | — | 2026-05-12 |
| Atherton | 77 Flood Cir | $27.75M | $34.50M | 70 | ✓ | 2026-05-08 |
| Woodside | 211 Winding Way | $23.00M | $25.00M | 248 | ✓ | 2026-04-09 |
| Atherton | 241 Polhemus Ave | $22.75M | $25.00M | 8 | ✓ | 2026-04-24 |
| Atherton | 98 Flood Cir | $22.00M | $20.00M | 18 | ✓ | 2026-06-10 |
| Palo Alto | 444 Tennyson Ave | $22.00M | $24.89M | 97 | — | 2026-05-22 |
| Atherton | 167 Almendral Ave | $21.90M | $24.50M | 98 | ✓ | 2026-06-23 |
| Atherton | 60 Ralston Rd | $21.20M | $18.00M | 4 | ✓ | 2026-05-28 |
YoY note: Q2 2025 recorded just 4 closings above $20M, at a median DOM of 57 days and median sale/orig of 86.6%; Q1 2026 ran 8 closings / 9 days / 100.0%. This quarter's 8 / 44 days / 91.5% sits between the two — cooled from Q1's frenzy, still meaningfully firmer than a year ago. Both years' samples are under 10 transactions; interpret ratios with caution.
Three observations
Observation 1: geographic concentration tightened further. Six of eight closings were in Atherton — including two on the same street (77 Flood Cir at $27.75M and 98 Flood Circle at $22M). Q1's eight were spread across Atherton, Woodside, and Palo Alto; Q2 collapsed to essentially a single-city market plus one Old Palo Alto transaction.
Observation 2: the bimodality moved from time to price. In Q1, the split showed up in DOM (either under 11 days or over 90). In Q2 it shows up in price: three homes sold 5.7%, 10.0% and 17.8% over original list (2 Somerset Ln, 98 Flood Circle and 60 Ralston Rd, at 11, 18 and 4 days on market), while five sold at 80–92% of original list after 8–248 days. Homes priced to market get bid up; homes anchored high surrender 8–20% to close — one band, two entirely different transaction logics.
Observation 3: six of eight all-cash — and one of the two financed deals was the quarter's largest. The financed closings were 2 Somerset Ln in Atherton ($28.0M, the quarter's top sale) and 444 Tennyson Ave in Palo Alto ($22M) — consistent with Section 4's leverage-returns finding: even above $20M, financing is no longer unthinkable. The off-market caveat stands: these six are MLS-recorded; industry estimates put unlisted activity at another 15–25% of public volume in this tier.
7. City Tiers: Six Groups, Six Narratives
Plotting Q2 data by city (median price × cash share × volume) surfaces the same six city groups as Q1 — the framework holds, with notable movement inside the tiers.
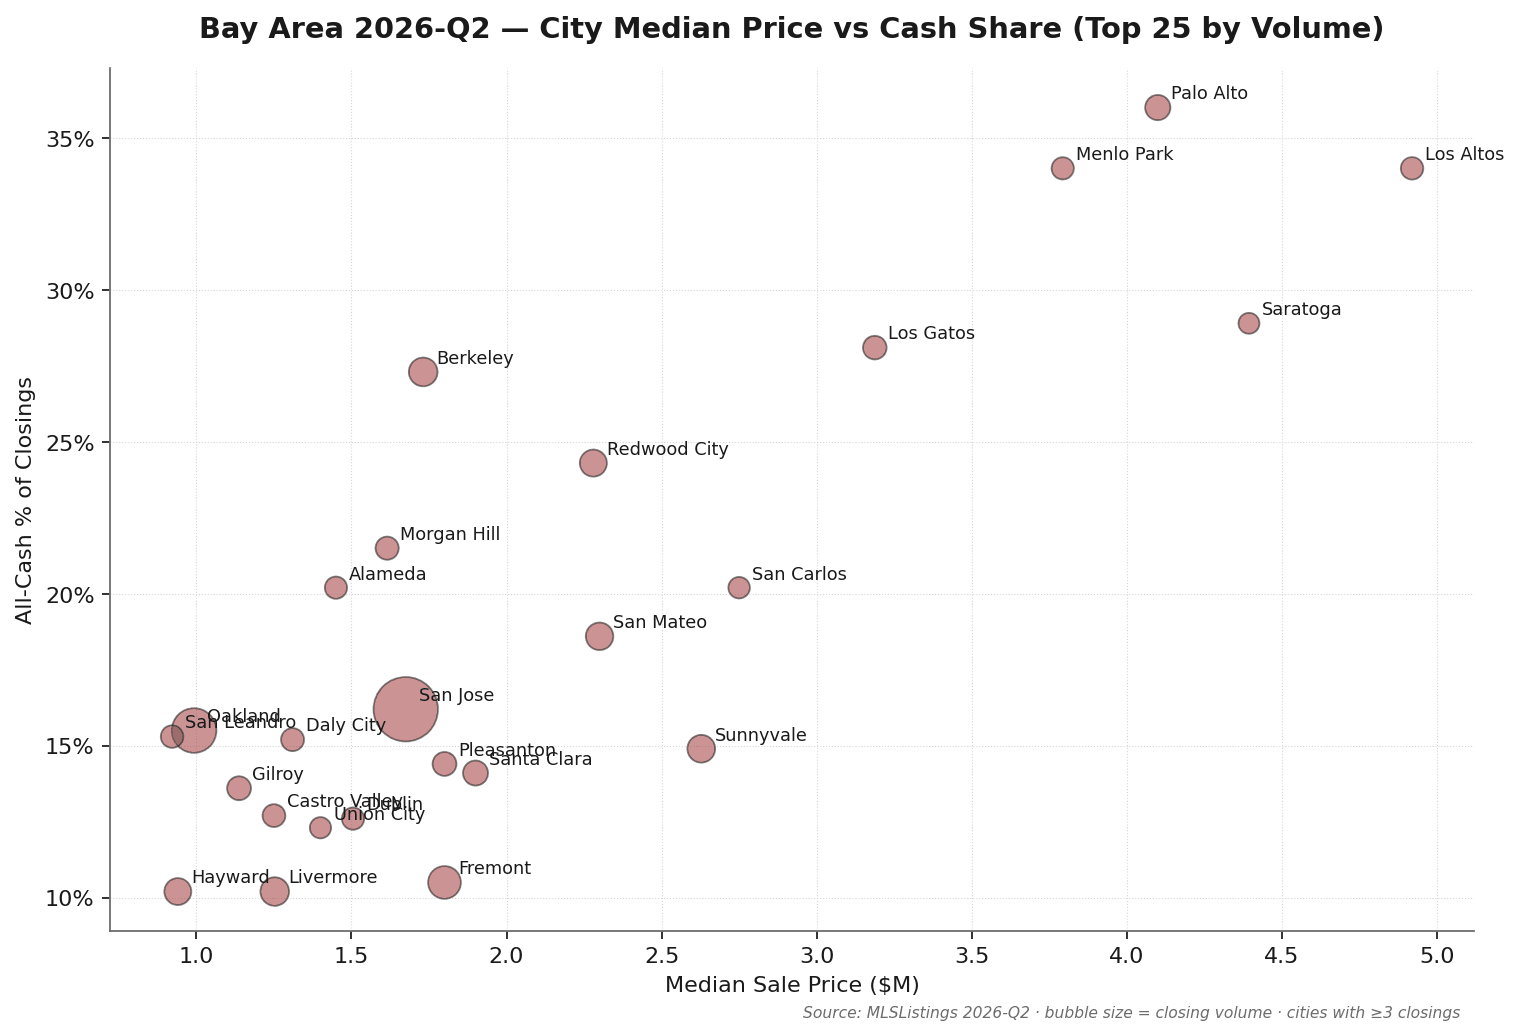
Tier 1 · Ultra-Luxury Anchor (Atherton / Hillsborough / Woodside / Los Altos Hills)
Median sale $5M+, cash share 34–75%, under 50 closings per city per quarter. This quarter's change is volume: Atherton logged 31 public closings (23 in Q2 2025) at a $10.00M median — an eight-figure single-city quarterly median for the third consecutive quarter. Woodside's 74.2% cash share was the region's highest. MLS still understates this tier's true activity given its off-market share.
Tier 2 · Premium School-District Core (Palo Alto / Los Altos / Cupertino / Menlo Park / Saratoga)
Median $3.3M–$5.0M, cash share 16–36%, tight seller's market. Palo Alto: 139 closings, $4.10M median (+10.8% YoY), sale-to-original 105.6%. Los Altos: 97 closings at $4.92M, the tier's highest. This tier is the geography behind the mid-tier squeeze — school-zone demand against rate-locked supply is most concentrated here.
Tier 3 · Tech Corridor Core (Sunnyvale / Mountain View / Santa Clara)
Median $1.9M–$3.1M, dense AI/FAANG buyer base. Sunnyvale: 181 closings, $2.63M median, sale-to-original 107.1% — the fiercest bidding in the South Bay core. Mountain View: 74 closings at $3.04M. Still the sweet spot for upper-mid tech buyers.
Tier 4 · Mainstream Housing Market (San Jose / Fremont / San Mateo / Redwood City)
The Bay Area's baseline. San Jose: 1,248 closings, 21.0% of regional volume, $1.68M median, 16.2% cash. A special mention for San Mateo: 177 closings, $2.30M median, sale-to-original 110.4% — mid-Peninsula commuter-belt bidding outran most of the South Bay this quarter.
Tier 5 · East Bay Expansion (Oakland / Berkeley / Hayward / Pleasanton / Livermore / Piedmont)
The widest internal variation of any tier — and home of the list-low-invite-bidding culture: Berkeley's median sale-to-original hit 131.3% (region high), Piedmont 121.8%, Oakland 110.5%. Read those ratios carefully: they reflect deliberate underpricing strategy, not Peninsula-style premiums. Oakland: 568 closings (regional No. 2) at $993K median; Pleasanton and Livermore ran sale-to-original at 100.0%. The East Bay still behaves like several distinct markets.
Tier 6 · Coastal / Outer Suburbs (Pacifica / Half Moon Bay / Gilroy / Morgan Hill)
Median $1.1M–$1.8M, DOM 9–16 days (Pacifica, Half Moon Bay, and Gilroy run visibly slower than the core; Morgan Hill is the exception), sale-to-original near 100%. Mortgage buyers dominate (cash share 13–27%), making this the most rate-sensitive tier — Q2's 31 bps rate rebound registered most directly here.
City data (20 representative cities)
| City | Closings | Median sale | Cash % | DOM | Sale/orig % |
|---|---|---|---|---|---|
| San Jose | 1248 | $1.68M | 16.2% | 10 | 102.6% |
| Oakland | 568 | $993K | 15.5% | 14 | 110.5% |
| Fremont | 277 | $1.80M | 10.5% | 10 | 103.5% |
| Berkeley | 198 | $1.73M | 27.3% | 14 | 131.3% |
| Livermore | 196 | $1.25M | 10.2% | 10 | 100.0% |
| Sunnyvale | 181 | $2.63M | 14.9% | 8 | 107.1% |
| San Mateo | 177 | $2.30M | 18.6% | 10 | 110.4% |
| Redwood City | 169 | $2.28M | 24.3% | 9 | 104.7% |
| Hayward | 167 | $940K | 10.2% | 11 | 101.6% |
| Palo Alto | 139 | $4.10M | 36.0% | 8 | 105.6% |
| Santa Clara | 135 | $1.90M | 14.1% | 10 | 104.6% |
| Pleasanton | 118 | $1.80M | 14.4% | 10 | 100.0% |
| Los Gatos | 114 | $3.19M | 28.1% | 13 | 100.0% |
| Los Altos | 97 | $4.92M | 34.0% | 8 | 105.1% |
| Menlo Park | 94 | $3.79M | 34.0% | 9 | 102.1% |
| San Carlos | 84 | $2.75M | 20.2% | 9 | 105.6% |
| Saratoga | 76 | $4.39M | 28.9% | 10 | 100.9% |
| Mountain View | 74 | $3.04M | 23.0% | 8 | 105.3% |
| Burlingame | 68 | $3.21M | 30.9% | 7 | 107.1% |
| Cupertino | 60 | $3.36M | 16.7% | 8 | 104.8% |
Source: MLSListings Q2 2026 · cities with 3+ in-quarter closings (57 cities ranked)
8. Takeaways for Sellers, Buyers, and Cross-Border Investors
For sellers
- The mid-tier ($1.5M–$5M) still closes at a premium, but pricing discipline matters more than in Q1. Market-wide median DOM moved from 8 to 12 days — buyers' decision windows are lengthening. The 105.3% median premium in $3M–$5M belongs to sellers who list at market and let competition lift the price. Do not list low to bait a bidding war, and do not list high to wait for a believer — Q2's $20M+ results are the cautionary tale for the latter.
- $5M–$10M supply is expanding (279 closings, +101% QoQ) — you have more competitors. Q1's instant-absorption window is narrowing: $10M–$20M median DOM stretched from 7 to 25 days. Eight to ten weeks of pre-listing preparation plus realistic pricing is worth more than ever — this quarter, overpriced $20M+ homes surrendered roughly 12% to close.
- Do not bet on "rates will dip, then I'll sell." Q2 rates rose (+31 bps QoQ) and buyers transacted anyway — volume +3.5% YoY. The cost of waiting is certain (carry cost plus growing competition); the timing of rate relief is not.
For buyers
- In $3M–$5M, keep the 5–10% over-list expectation. Two straight quarters as the most competitive band; an 84% supply surge changed nothing. Structural advantages — cash ratio, down payment size, fast close — still beat incremental over-bidding.
- The $10M+ negotiating window reopened after Q1's frenzy. $10M–$20M median DOM 25 days and sale-to-original 96.3%, with a series-high 47 closings at $10M+ — this band shifted from seller-paced to negotiated. If you have been waiting on the sidelines at this tier for the past year, Q2's numbers justify re-engaging.
- School-zone buyers: waiting has a measurable price. Palo Alto's median rose 11.4% YoY ($3.68M → $4.10M) — a year of waiting cost roughly $420K on the same home. Cupertino ($3.36M median) and Saratoga ($4.39M median, sale-to-original 100.9%) remain the comparatively rational entries.
For cross-border investors
- The all-cash advantage in $5M–$10M is intact but narrowing at the margin. Cash share there is 44.4% — a cash offer still puts you in the top half, but with local buyers financing again (55.6% of the band), cash alone carries less scarcity premium than in Q1. Cash plus fast close plus clean contingencies beats cash alone.
- Finalize trust / LLC ownership structure before any offer. FIRPTA withholding (15% for foreign sellers), estate tax exposure, and FinCEN BOI reporting are all expensive to restructure after the fact. Cross-border capital paths (compliant FX purchase + offshore intermediary bank + U.S. escrow) are mature; the binding constraint is almost always structure decided too late.
- The rate environment is a relative tailwind for cross-border cash buyers. Local buyers' mortgage cost rebounded to 6.41%; cross-border cash does not reprice with U.S. rates. Q2's combination — rising rates plus expanding supply — is precisely the window where cash buyers' bargaining power improves.
⚠️ Tax and legal content in this section is for general informational purposes only and does not constitute professional advice. Consult a qualified tax attorney or CPA for your specific situation.
9. Methodology & Definitions
Data source
Core data sourced from MLSListings (the primary Bay Area MLS, covering Santa Clara, San Mateo, Santa Cruz, and Monterey counties, with regional agreements extending coverage to Alameda, Contra Costa, San Francisco, Marin, and Solano). Macro indicators from FRED (Freddie Mac PMMS, U.S. Treasury, BLS, S&P Global, S&P CoreLogic).
Time window
- Q2 in-quarter data: CloseDate [2026-04-01, 2026-06-30], 5,941 records
- From this issue onward, Pulse covers in-quarter data only — no QTD supplement (the QTD chapter in the debut Q1 2026 issue was a one-time arrangement).
Property type
Single Family Residential (SFR) only. Condos, multi-family, and land excluded.
All-cash definition
MLSListings "Buyer Financing" field value of "All Cash No Loans" or "Cash to Existing Loan" classified as cash. All other values (Conventional, FHA, VA, Private, etc.) classified as financed. Field completeness: 99.2% in this dataset, with definitions identical to Q1 2026 and the archived 2025 baselines.
Price band classification
Based on Sale Price (actual close price), not List Price. All medians are statistical medians, not means.
Exclusions
- Status = Cancelled / Expired / Withdrawn: excluded
- Sale Price < $100,000: excluded (likely family/trust/divorce transfers)
- Records with a missing Sale Price: excluded (1 record this quarter)
Verification
The cash-classification benchmark established in the Q1 2026 issue carries forward: that issue sampled 20 transactions in the $5M+ segment against publicly-recorded Santa Clara and San Mateo County Deed of Trust filings, with the MLSListings Buyer Financing field matching 95% of the time (19 of 20). This issue uses the same field and criteria.
Known limitations
- Off-market transactions not on MLS are excluded. Industry estimates suggest $5M+ off-market volume adds 15–25% on top of public MLS counts. The 8-transaction $20M+ figure reflects only public closings.
- The $20M+ and $10M–$20M samples are small (n=6 / n=33); single-quarter ratios are volatile, and trend judgments should rest on consecutive quarters.
- School-zone-level segmentation remains under data validation and is not in this issue; it will be added as a standalone section once validated.
10. About MK Group
MK Group (Meridian Keystone Real Estate Group) is a Bay Area real estate team based in Cupertino, co-founded by Marie Wang (DRE# 02110980) and Kevin Mo (DRE# 02127623), operating with Keller Williams Realty.
The team focuses on the $3M–$30M+ buy and sell market across the SF Peninsula and South Bay, with deep specialization in cross-border buyer advisory. MK Group is one of the few Bay Area teams with both deep English-language market fluency and native Chinese-language service capability — 68K+ combined YouTube subscribers (@MarieWang 44K+ / @KevinMoRE 24K+), plus Xiaohongshu and WeChat reach.
About the MK Bay Area Pulse Series
Pulse is a quarterly market intelligence report grounded in complete MLS closing data, FRED macro indicators, and direct transaction observations from 200+ client engagements. It is designed to serve buyers, sellers, investors, media, and researchers who need data-driven, source-transparent, cross-tier Bay Area market analysis.
Citation
Please cite as: "MK Bay Area Pulse 2026-Q2, MK Group"
For high-resolution charts, full dataset, or press inquiries, contact Marie Wang(marie@mkbayarea.com) or Kevin Mo(kevin@mkbayarea.com), write to team@mkbayarea.com, or use the form at mkbayarea.com/contact
Next issue
Q3 2026 Pulse is expected in early October 2026 — the first issue in the series with three consecutive quarters plus two same-quarter years of fully comparable data.
Questions about your specific situation?
Data provides context — your decision depends on your timeline, budget, and goals. Reach out to Marie Wang or Kevin Mo directly. First consultation is always free and carries no obligation.