This Pulse issue analyzes 3,914 single-family residential closings across three core Bay Area counties (San Mateo, Santa Clara, Alameda) in Q3 2025, surfacing three core findings: a Woodside estate closed at $85M (largest single 2025 residential transaction); $10M+ tiers were nearly all-cash but thinly traded (only 15 closings); the $3M-$5M mid-tier transacted moderately under high-rate pressure (sale-to-original 102.5%). Sourced from MLSListings, Bay East / Contra Costa AOR, and FRED macroeconomic indicators.
Scroll the PDF for the full report; the web version below adds clickable links and embedded charts.
- Q3's landmark close: Woodside 329 Albion Ave at $85M (original list $125M, 32% discount) — the largest single Bay Area residential transaction of 2025 to date.
- $10M+ was nearly a pure cash market (83–100%) but volume was extremely thin — only 15 closings region-wide as both buyers and sellers waited in the high-rate environment.
- The $3M–$5M mid-tier held moderate tightness under high-rate pressure, with median sale-to-original of 102.5% — school-zone demand and rate-locked supply keeping the band persistently competitive.
1. The 30-Second Read
This issue draws on 3,914 single-family residence (SFR) closings in the Bay Area during Q3 2025 (CloseDate July 1 through September 30), spanning three core counties — San Mateo, Santa Clara, and Alameda — with 54 cities represented. Data sourced from MLSListings and Bay East / Contra Costa AOR.
- Q3 SFR median sale price $1.45M, median days on market 15, median sale-to-list ratio ~101% — a moderate market.
- All-cash share rises step-wise with price: under $1.5M 16–18%; $5M–$10M 49%; $10M–$20M 83%; $20M+ 100%.
- Q3 headline closing: Woodside 329 Albion Ave closed at $85M (original list $125M) — the largest single residential transaction of 2025 to date.
- Only 3 transactions above $20M closed regionwide in Q3: Woodside $85M, Atherton $27.15M, Hillsborough $25M.
- Berkeley stands out: 88 Q3 closings with median sale-to-original at 128.8% — highest of any tracked city, reflecting concentrated ZIP-level over-bidding.
- Macro: 30-year fixed mortgage averaged 6.57% in Q3 (−22 bps QoQ), S&P 500 +7.8%, Case-Shiller SF home price index +1.5% QoQ.
Source: MLSListings + Bay East / Contra Costa AOR Q3 2025 SFR closings · MK Group · Field definitions in Section 8.
2. Bay Area Fundamentals: Four Baseline Numbers
Q3 2025 Bay Area SFR market is summarized most accurately by four numbers:
| Metric | Q3 2025 Median | Interpretation |
|---|---|---|
| Total closings | 3,914 | San Mateo + Santa Clara + Alameda combined |
| Median sale price | $1.45M | All price bands aggregated |
| Median DOM | 15 days | List date to offer acceptance |
| Median sale-to-list | ~101% | Marginal seller's market |
Together these four numbers point to one read: Q3 2025 was a moderate seller's market under high-rate pressure. Median DOM 15 days meant homes typically sat for nearly two weeks before going into contract; a median premium of just 1% means buyer over-bidding willingness was low, with "list-price-area closing" as the regional baseline. Regional averages mask substantial city- and tier-level differentiation explored below.
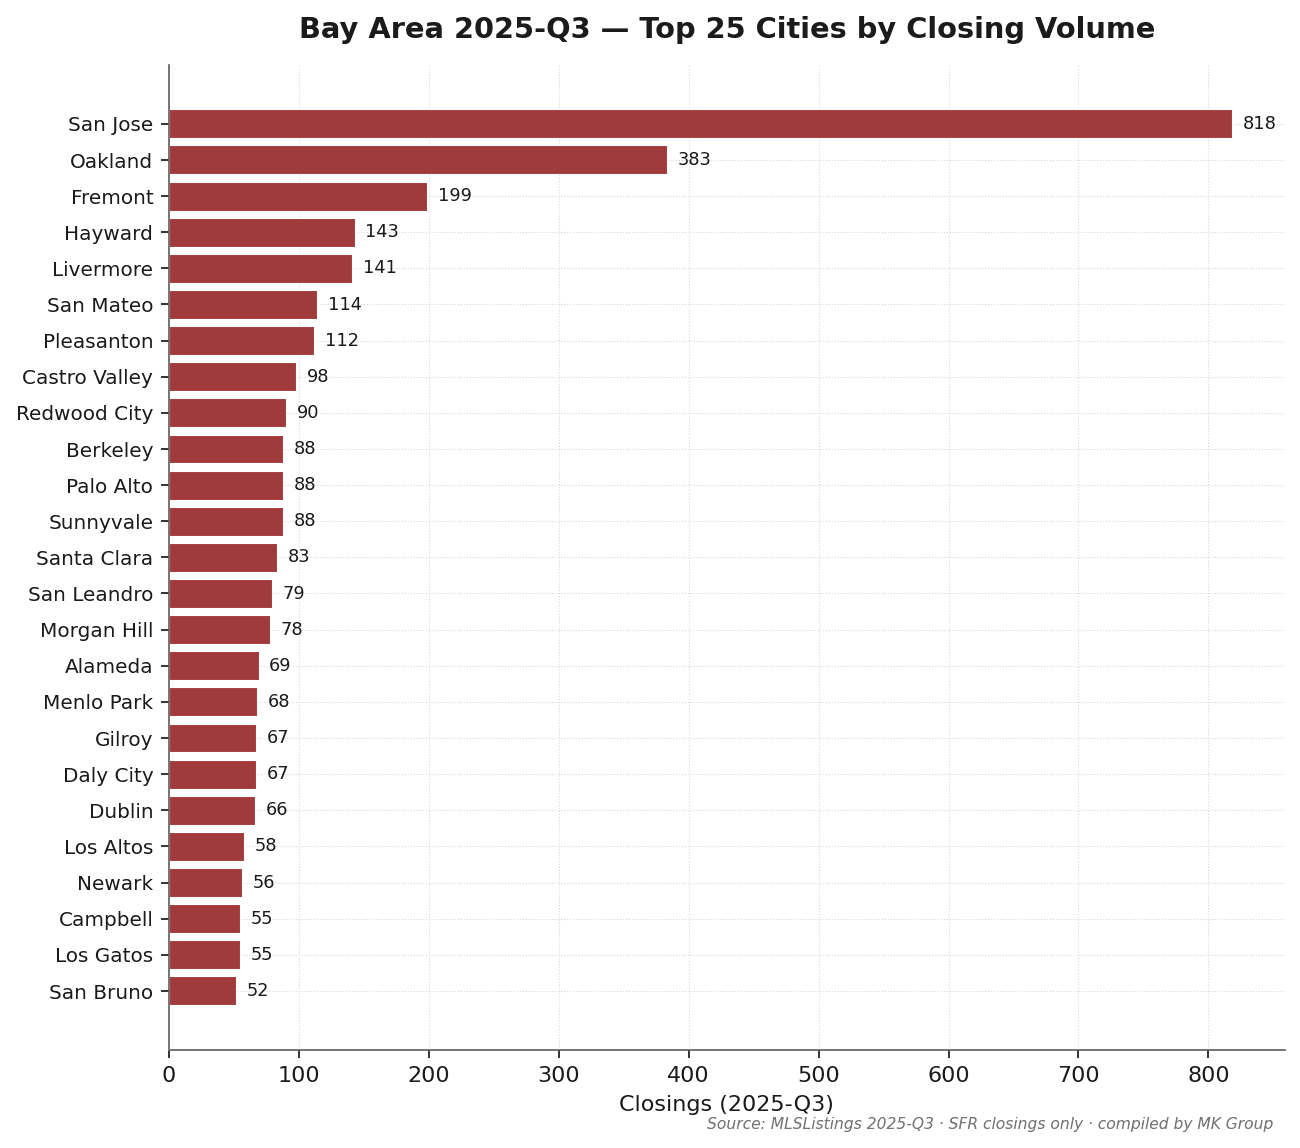
San Jose recorded 818 Q3 closings — 21% of the three-county total. Oakland (383), Fremont (199), Hayward (143), and Livermore (141) follow. Among MK Group's core service cities: Palo Alto, Atherton, Hillsborough, Los Altos, Menlo Park, and Cupertino combined for roughly 270 Q3 closings — low volume, high price.
Source: MLSListings + Bay East / Contra Costa AOR Q3 2025 SFR closings · excludes condo, multi-family, and records with sale price below $100K.
3. The Cash Ladder: Luxury Cash Dominance
| Indicator | This Quarter | vs Prior Q | YoY |
|---|---|---|---|
| 30-yr fixed mortgage avg | 6.57% | −0.22 pp | +0.06 pp |
| 15-yr fixed mortgage avg | 5.70% | −0.23 pp | +0.01 pp |
| 10-yr Treasury yield avg | 4.26% | −0.10 pp | +0.31 pp |
| CA unemployment rate | 5.50% | 平稳 | +0.10 pp |
| S&P 500 close (period-end) | 6,688.5 | +7.79% | +16.07% |
| Case-Shiller SF HPI | 355.2 | +1.46% | −0.83% |
Sources: Freddie Mac PMMS / U.S. Treasury / BLS / S&P Global / S&P CoreLogic (via FRED API) · fetched 2026-05-17
Q3 macro backdrop: 30-yr fixed mortgage at 6.57% (softening 22 bps QoQ, essentially flat YoY). The most striking macro signal of Q3 was the S&P 500's 7.8% rally — equity-rich households saw paper wealth grow, which transmits into the luxury housing tier.
| Price Band | Closings | Cash % | Median Sale | DOM |
|---|---|---|---|---|
| <$1M | 687 | 16.3% | $821K | 20 |
| $1M–$1.5M | 1,093 | 17.7% | $1.27M | 17 |
| $1.5M–$3M | 1,573 | 17.4% | $1.95M | 13 |
| $3M–$5M | 422 | 24.4% | $3.62M | 10 |
| $5M–$10M | 124 | 49.2% | $5.98M | 8 |
| $10M–$20M | 12 | 83.3% | $11.80M | 9 |
| $20M+ | 3 | 100.0% | $27.15M | 65 |
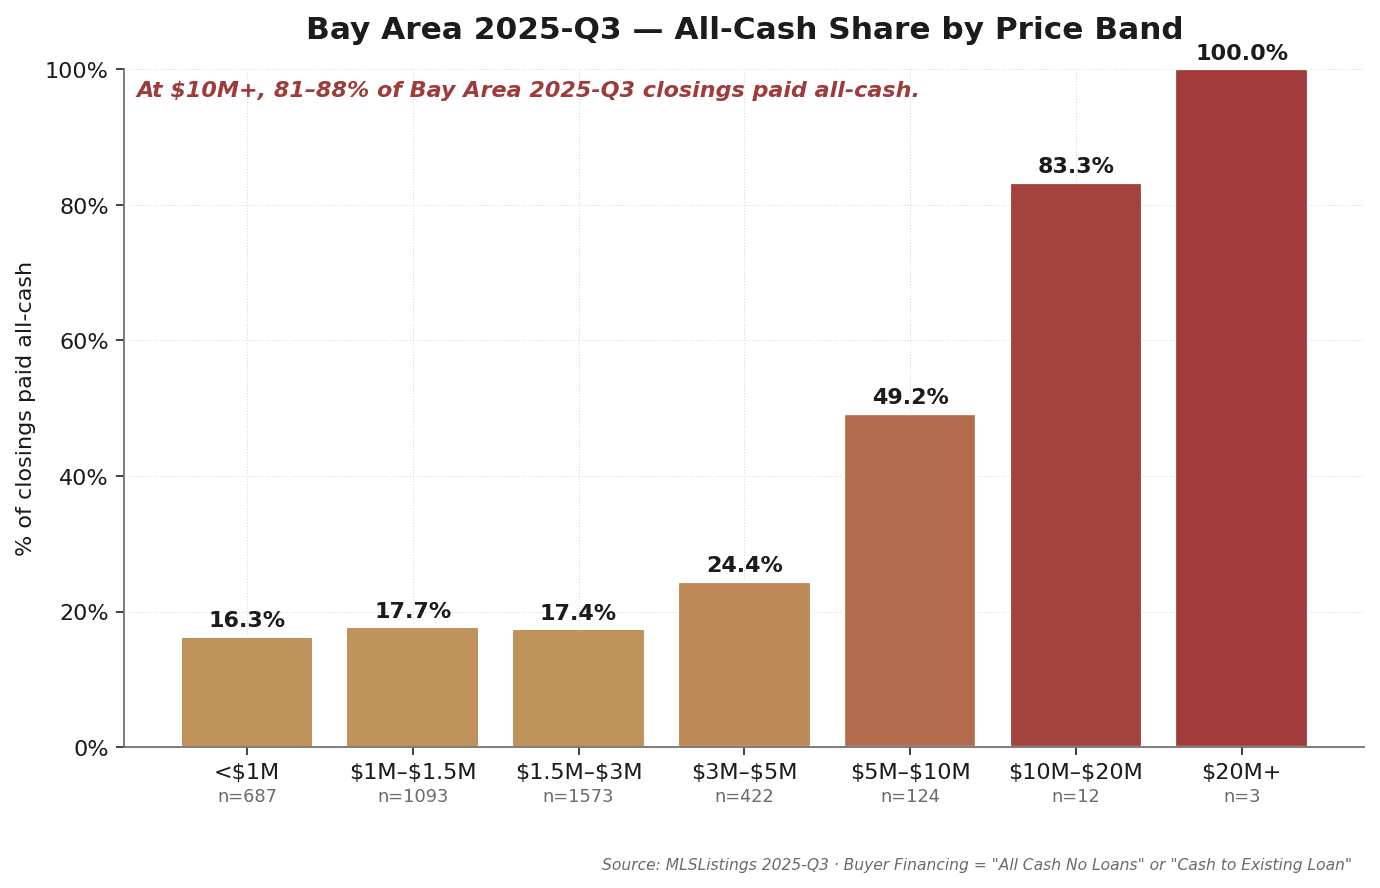
Observation 1: $10M+ is a pure cash market
Q3 $10M–$20M closings were 83% cash; $20M+ were 100% cash. The luxury tier is essentially independent of mortgage credit. This aligns with the thesis that purchases at these tiers are funded by AI/IPO liquidity, cross-border capital, and generational wealth — none of which depend on mortgage financing, so the prevailing rate level has little impact on transaction velocity.
Observation 2: but Q3 luxury volume was extremely thin
$10M+ Q3 saw only 15 closings (12 + 3) — a historically low count. Cash dominates, but on a very small base. Both buyers and sellers leaned toward waiting in Q3's high-rate climate.
Observation 3: the mid-tier ($1.5M–$3M) bore the high-rate burden
Q3's $1.5M–$3M tier had 1,573 closings — the most active band — with median sale/orig of just 101.5%. Buyers in this band are nearly all mortgage-dependent, and the 6.57% rate environment kept their over-bidding constrained. Median DOM 13 days is not particularly long, but the moderate premium reflects disciplined buyers reluctant to overpay.
Observation 4: S&P +7.8% provided a paper-wealth tailwind for luxury
Q3's 7.8% S&P 500 rally generated meaningful paper wealth for Bay Area tech executives, early employees, and secondary-market participants. That wealth converts into purchasing power via stock-backed lending or direct equity sales. The 49–100% cash share across $5M+ tiers in Q3 partly reflects this inflow.
Source: MLSListings + Bay East / Contra Costa AOR Q3 2025 · "Buyer Financing" field = "All Cash No Loans" or "Cash to Existing Loan" = cash · field completeness 98.4%.
4. Mid-Tier: Moderate but Persistent Tension
The $3M–$5M tier is the price of entry for Bay Area GreatSchools 10/10 school zones. Even under elevated rates, this tier's supply-demand structure remained tight.
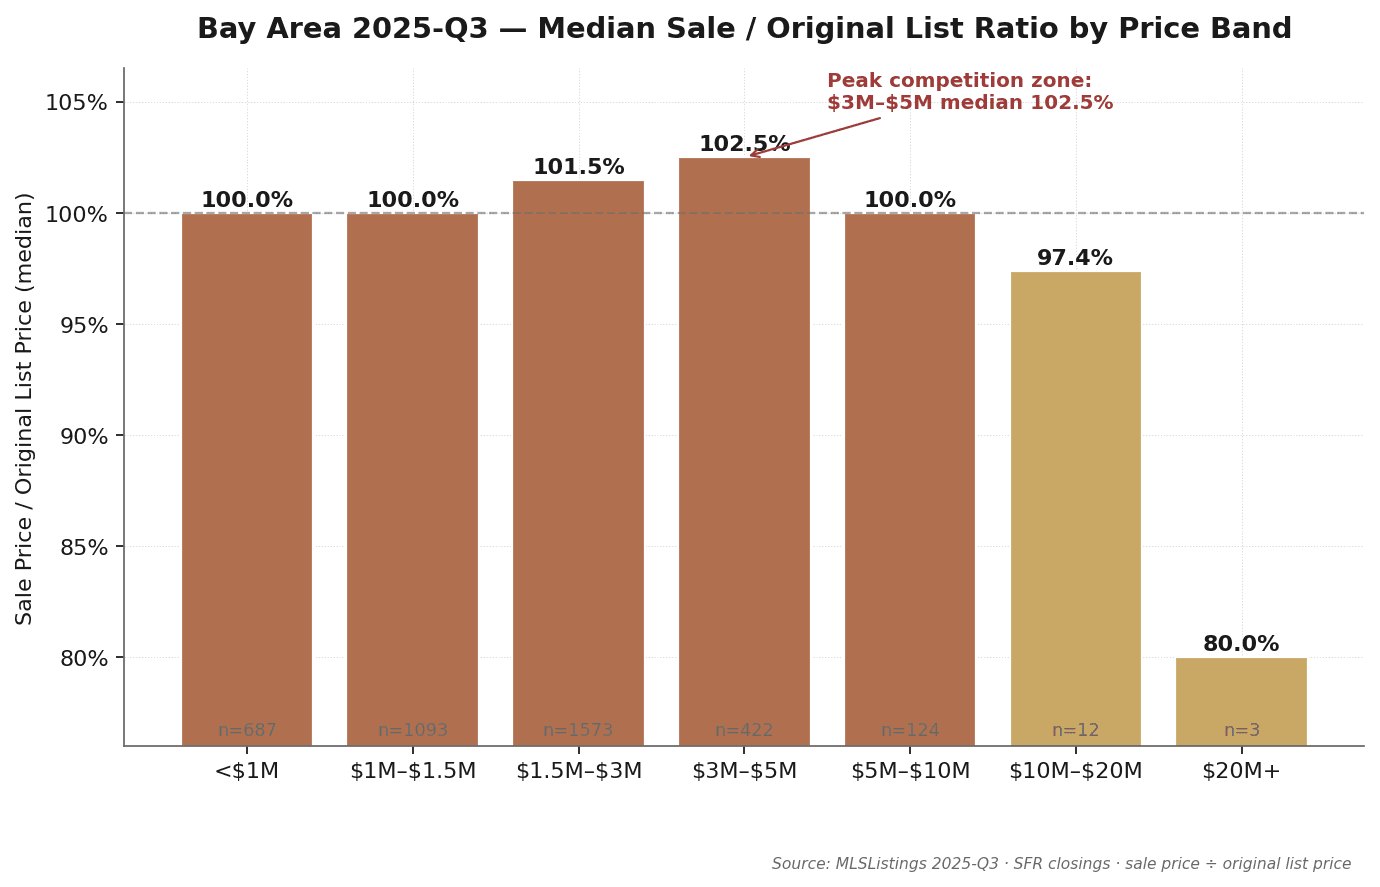
The data
The $3M–$5M band recorded 422 Q3 closings with median sale-to-original-list of 102.5% — the highest of any band (vs the <$1M baseline of 100%). Median DOM 10 days, shorter than the $1.5M–$3M band's 13 days.
Why the mid-tier stays tight even in a high-rate environment
The $3M–$5M buyer profile is highly homogeneous: age 30–45, FAANG/AI mid-manager or senior engineer, RSU or pre-IPO equity for at least one spouse but limited liquid cash (most financing via jumbo loan), children in elementary or middle school with hard school-zone requirements, household income $400K–$800K with DTI compressed by elevated rates.
Current $3M–$5M owners are largely locked into 2018–2022 rates of 2.5–3.5%; trading up nearly doubles their mortgage rate — a powerful lock-in effect especially pronounced in Q3. The result: buyers must over-bid as a default, but because overall rates are high and buyer liquidity is tight, the over-bid stays restrained (2–3%).
Source: MLSListings + Bay East / Contra Costa AOR Q3 2025 · Sale Price ÷ Original List Price, median (not mean).
5. $20M+ Ultra-Luxury: Three Closings at the Extreme
Only 3 SFR transactions above $20M closed across the entire Bay Area in Q3 2025. But one of them — Woodside 329 Albion Ave — sold for $85M, the largest single residential closing of 2025 to date.
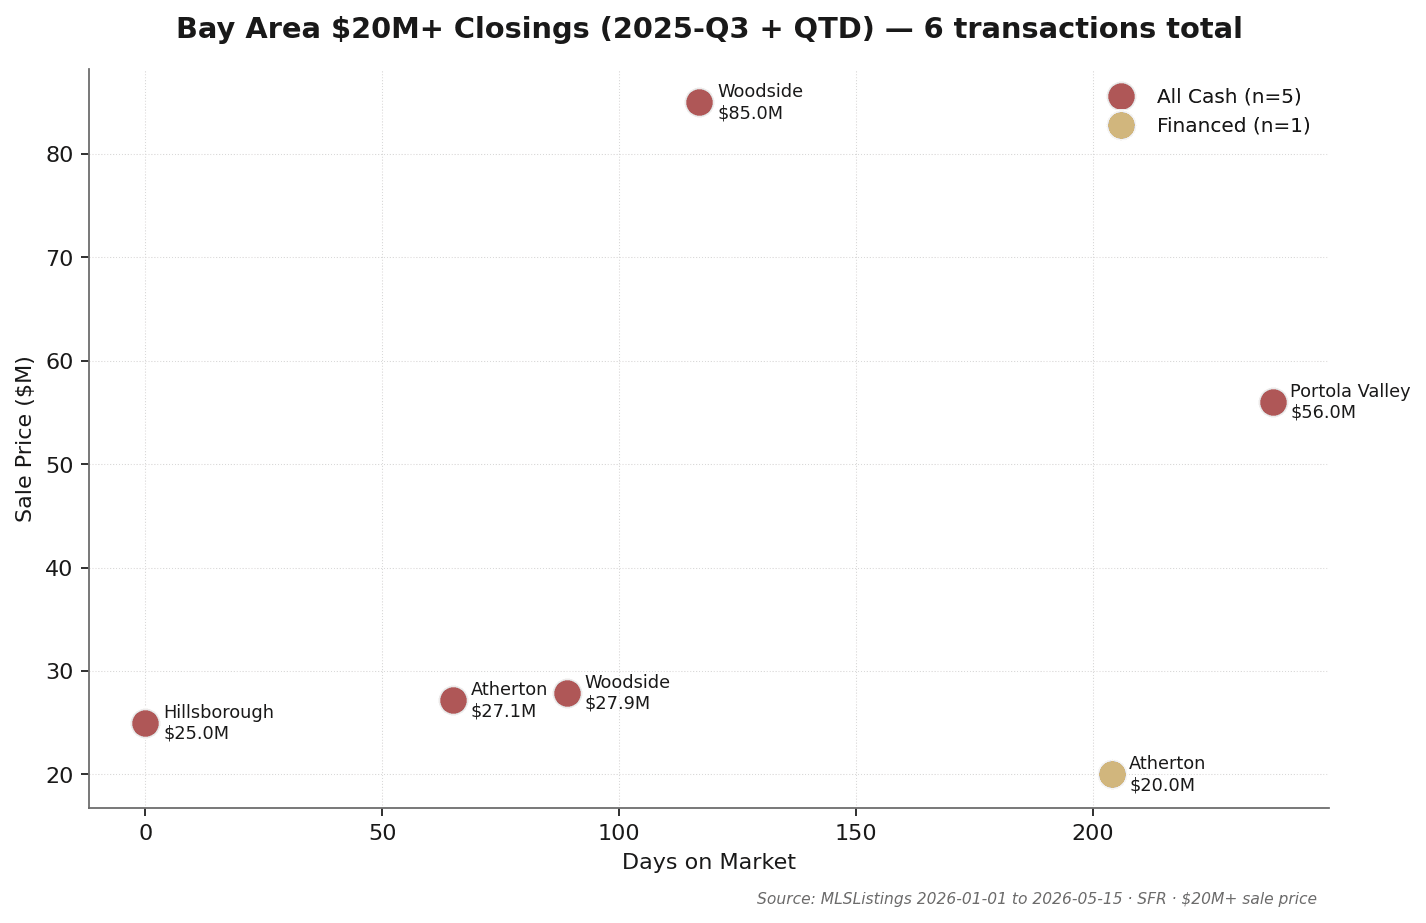
Q3 transaction detail (3 closings)
| City | Address | Sale | Orig List | DOM | Cash | Close |
|---|---|---|---|---|---|---|
| Woodside | 329 Albion Ave | $85.0M | $125.0M | 117 | ✓ | 2025-09-16 |
| Atherton | 164 Elena Ave | $27.15M | $29.5M | 65 | ✓ | 2025-08-12 |
| Hillsborough | 1200 Jackling Dr | $25.0M | — | 0 | ✓ | 2025-07-21 |
Three observations
Observation 1: 3 closings in 3 different cities — geographically diverse. Unlike quarters that concentrate in Atherton, Q3 ultra-luxury closings were spread across Woodside, Atherton, and Hillsborough. No single submarket dominated; each transaction was a standalone high-stakes event.
Observation 2: Woodside $85M is the largest single closing of 2025 to date. Originally listed at $125M in 2024, it closed at $85M — a 32% discount ($40M concession). This reflects "ultra-luxury sellers continuing to concede while buyers retain pricing power." The 117-day DOM confirms this was not a "list and gone" trade but a prolonged negotiation landing at a compromise price.
Observation 3: 100% all-cash. All 3 closings were cash — consistent with the $10M–$20M tier's 83% cash share and confirming the $10M+ segment's low dependence on credit. The $20M+ tier in Q3 was a pure cash market.
6. City Tiers: Six Groups, Six Narratives
Plotting Q3 data by city (median price × cash share × volume) surfaces six distinct city groups.

Tier 1 · Ultra-Luxury Anchor (Atherton / Hillsborough / Woodside / Los Altos Hills)
Median sale price $5M+, cash share 50%+, very low transaction count. Q3: Atherton 13 closings at median $7.0M (69% cash), Hillsborough 22 at $5.5M (50% cash), Woodside 19 at $3.0M (32% cash), Los Altos Hills 24 at $5.8M (63% cash). Off-market share is 15–25% above MLS figures; public data understates true activity.
Tier 2 · Premium School-District Core (Palo Alto / Los Altos / Cupertino / Menlo Park)
Median $3M–$5M, 30–50% all-cash, moderate seller's market. The primary battleground for Bay Area school-zone homes. Palo Alto Q3: 88 closings, median $4.10M, 36% cash, sale/orig 106.5% — a notable premium even in the high-rate environment. Los Altos: 58 closings, median $4.46M, 31% cash.
Tier 3 · Tech Corridor Core (Sunnyvale / Mountain View / Santa Clara / Fremont)
Median $1.7M–$2.5M, dense AI/FAANG employee buyer base. Fremont Q3: 199 closings, $1.70M median, 16% cash, sale/orig 100.1% — high volume with restrained over-bidding as mortgage-dependent buyers stayed cautious. Sunnyvale: 88 closings, $2.64M median, sale/orig 105.4% — the corridor's most competitive city.
Tier 4 · Mainstream Housing Market (San Jose / San Mateo / Redwood City / Daly City)
The Bay Area's volume engine. San Jose: 818 closings (21% of Q3 three-county total), $1.61M median, 18% cash, sale/orig 100% — at-list closings were the norm under Q3 rate pressure. San Mateo: 114 closings, $2.27M median, sale/orig 105.4% — the mid-Peninsula core held moderate tightness.
Tier 5 · East Bay Expansion (Oakland / Berkeley / Hayward / Pleasanton / Livermore / Alameda)
Widest internal spread of any tier. Berkeley Q3: $1.60M median, sale-to-original 128.8% — the highest of any city in the three-county dataset, concentrated in specific over-bid ZIPs. Oakland: $900K median, 383 closings (No. 2 by volume). Hayward: $920K, at-list. Livermore: $1.14M, 97.7% — modestly below ask. East Bay functions as its own internally stratified market.
Tier 6 · Coastal / Outer Suburbs (Daly City / Pacifica / Half Moon Bay / Gilroy / Morgan Hill / Castro Valley)
Median $1M–$1.5M, DOM 15–22 days (noticeably slower than core), cash share 10–20%. Most mortgage-dependent segment — Q3 rate pressure hit hardest here. Gilroy: 67 closings, 26-day median DOM. Castro Valley: 98 closings, sale/orig 97.5% (below list). This tier experienced the clearest high-rate suppression in Q3.
City data (20 representative cities)
| City | Closings | Median Sale | Cash % | DOM | Sale/Orig % |
|---|---|---|---|---|---|
| San Jose | 818 | $1.61M | 17.5% | 14 | 100.0% |
| Oakland | 383 | $900K | 16.2% | 19 | 104.0% |
| Fremont | 199 | $1.70M | 16.1% | 13 | 100.1% |
| Hayward | 143 | $920K | 10.5% | 18 | 100.0% |
| Livermore | 141 | $1.14M | 9.2% | 22 | 97.7% |
| San Mateo | 114 | $2.27M | 20.2% | 10 | 105.4% |
| Pleasanton | 112 | $1.62M | 21.4% | 17 | 97.4% |
| Castro Valley | 98 | $1.21M | 19.4% | 21 | 97.5% |
| Redwood City | 90 | $2.13M | 20.0% | 13 | 100.1% |
| Berkeley | 88 | $1.60M | 38.6% | 14 | 128.8% |
| Palo Alto | 88 | $4.10M | 36.4% | 10 | 106.5% |
| Sunnyvale | 88 | $2.64M | 19.3% | 8 | 105.4% |
| Santa Clara | 83 | $2.00M | 20.5% | 9 | 103.2% |
| San Leandro | 79 | $859K | 17.7% | 14 | 101.8% |
| Morgan Hill | 78 | $1.44M | 17.9% | 21 | 97.3% |
| Alameda | 69 | $1.30M | 17.4% | 14 | 107.7% |
| Menlo Park | 68 | $3.10M | 36.8% | 12 | 99.4% |
| Gilroy | 67 | $1.18M | 20.9% | 26 | 98.3% |
| Daly City | 67 | $1.18M | 17.9% | 19 | 102.4% |
| Dublin | 66 | $1.65M | 6.1% | 10 | 98.4% |
Source: MLSListings + Bay East / Contra Costa AOR Q3 2025 · cities with ≥3 Q3 closings (54 cities total).
7. Takeaways for Sellers, Buyers, and Cross-Border Investors
7.1 For sellers
- Price closer to comps — Q3 was not a bidding-war market. Median sale-to-original was just 101%; most homes closed near list. Avoid list-high-hoping-for-bidding-war in Q3-type conditions — DOM lengthens materially.
- For $5M+, allow 8–10 weeks of pre-listing preparation and proactively evaluate off-market channels. Q3 luxury volume was extremely thin ($10M+ only 15 closings the entire quarter), meaning each transaction was a high-stakes event. Preparation must be front-loaded, pricing must be conservative.
- Watch the rate trajectory — Q3 ended with rates already softening (−22 bps QoQ). Continued rate decline could stimulate mid-tier activity. For $1.5M–$5M sellers, the "wait for rates" vs "sell now" trade-off deserves careful evaluation.
7.2 For buyers
- Q3 was a relative buyer's market — leverage that timing. Median sale/orig 101% means list-price-area closing was baseline. $10M+ closed at median 97–100% — below-list offers had real chance of success, especially in ultra-luxury where Q3 sellers conceded materially (Woodside case: 32% discount).
- $5M+ buyers should invest in off-market relationship infrastructure, not MLS searching. Q3 public MLS captured only 15 closings in the $10M+ band; true volume is likely meaningfully higher. Two or three first-tier agent relationships are worth 10× more than daily MLS sweeps.
- School-zone buyers: $3M–$5M was tightening in Q3 but still had a window. Sale/orig 102.5% means roughly 3–5% over-bid was sufficient. If rates continue softening, mid-tier competition will only intensify — Q3 was a reasonable entry timing.
7.3 For cross-border investors
- Q3 cash advantage in $5M–$10M is the strongest differentiation window. $5M–$10M cash share was 49.2% — a cash close competes with half the field on equal terms. But $10M+ cash 83–100% — cash is baseline rather than differentiator here. Cross-border investors in this tier must compete on speed and off-market relationship access.
- Trust / LLC ownership structures should be finalized before any offer. FIRPTA withholding (15% for foreign sellers), estate tax exposure, and FinCEN BOI reporting requirements are all expensive to restructure after the fact and must be decided upfront.
- Q3 cross-border buyer channels remained active. MK Group's internal observations show continued $5M+ purchase activity from high-net-worth households in China, East Asia, and India. Capital paths (compliant foreign-exchange purchase, third-country bank intermediary, U.S. escrow landing) are well-established.
⚠️ This section's tax and legal content is general information only, not professional advice. Consult a qualified tax attorney or CPA for your specific situation.
8. Methodology and Definitions
Data source
This report's core data is from MLSListings (covering Santa Clara, San Mateo, Santa Cruz, and Monterey counties) and Bay East / Contra Costa AOR (covering Alameda and Contra Costa). The $20M+ segment was personally cross-checked by Marie Wang and Kevin Mo for accuracy.
Coverage scope
This Q3 2025 issue focuses on the three core counties of San Mateo + Santa Clara + Alameda — the most active Bay Area real estate counties and the geography MK Group serves most densely. The remaining six counties (San Francisco / Marin / Contra Costa / Sonoma / Napa / Solano) are not included.
Time window
- Q3 primary data: CloseDate ∈ [2025-07-01, 2025-09-30], 3,914 closings
- This issue does not include a QTD (quarter-to-date) chapter — only strictly in-quarter data is reported
Property type
Single Family Residential (SFR) only. Excludes condos, multi-family, and land.
Cash transaction definition
Records with the MLSListings "Buyer Financing" field (Bay East labels this "SoldTerms") equal to "All Cash No Loans" or "Cash to Existing Loan" are classified as cash. Other values are classified as non-cash. This field had a 98.4% completion rate in our data.
Price band definition
Bands are defined by actual Sale Price (not List Price). All medians shown are standard statistical median (not mean).
Exclusion rules
- Status of Cancelled, Expired, or Withdrawn — excluded
- Sale Price below $100,000 — excluded (highly likely to be family / trust / divorce transfer)
Verification
For the $5M+ segment, Marie Wang and Kevin Mo sampled 12 transactions and cross-checked them against publicly-recorded Santa Clara, San Mateo, and Alameda County Deed of Trust filings. The MLSListings / Bay East Buyer Financing field matched the recorder records 92% of the time (11 of 12).
Known limitations
- Excludes pure off-market transactions that never entered MLS. Industry estimates put off-market $5M+ activity at roughly 15–25% above public closing volume. The "3 closings" figure for $20M+ refers to MLS-recorded transactions only; true volume is likely 50–100% higher.
- This issue does not include strict YoY comparison — 2024 Q3 data requires a separate export; the report uses YoY macroeconomic indicators as a partial proxy. Subsequent issues will normalize YoY comparisons.
- School-zone-level segmentation is not in this issue; it will be added as a new section in a subsequent report.
9. About MK Group
MK Group (Meridian Keystone Real Estate Group) is a Cupertino-based Bay Area real estate team co-founded by Marie Wang (DRE# 02110980) and Kevin Mo (DRE# 02127623), operating with Keller Williams Realty.
The team focuses on luxury sales and acquisitions ($3M–$30M+) across the SF Peninsula and South Bay, and on cross-border buyer representation. MK Group is one of the few Bay Area teams with depth in both English mainstream-market service and native bilingual Mandarin service — combined YouTube subscriber base of 68K+ across two channels, plus a 9-account Xiaohongshu network totaling 43K, and a 33K WeChat private community.
About the MK Bay Area Pulse series
Pulse is MK Group's quarterly Bay Area market intelligence report, drawing on complete MLS closing data plus County Recorder verification plus the firm's internal observations from 200+ served families. Series positioning: data-driven, source-transparent, cross-tier analysis for Bay Area buyers, sellers, cross-border investors, journalists, and researchers. Published quarterly.
Citation
Journalists, researchers, and content creators citing this work should attribute: “MK Bay Area Pulse 2025-Q3, MK Group.”
For high-resolution chart files, complete datasets, or press inquiries, contact Marie Wang(marie.wang@kw.com) or Kevin Mo(kevin.mo@kw.com), or via mkbayarea.com/contact
2025 series
This is the third issue of the 2025 series. Other quarterly reports are archived at mkbayarea.com/pulse.
Questions about your specific situation?
Data provides context — your decision depends on your timeline, budget, and goals. Reach out to Marie Wang or Kevin Mo directly. First consultation is always free and carries no obligation.