This Pulse issue analyzes 3,360 single-family residential closings across three core Bay Area counties (San Mateo, Santa Clara, Alameda) in Q4 2025, surfacing three counterintuitive findings: luxury had not yet fully decoupled from credit ($10M+ at 65-75% all-cash), the $3M-$5M mid-tier had begun tightening (sale-to-original 104.9%), and ultra-luxury was essentially frozen (only 4 transactions above $20M region-wide). Sourced from MLSListings, Bay East / Contra Costa AOR, and FRED macroeconomic indicators.
Scroll the PDF for the full report; the web version below adds clickable links and embedded charts.
- Luxury had not yet fully decoupled from credit — $10M–$20M at 65% cash, $20M+ at 75%, showing Q4 was still a transition quarter.
- The $3M–$5M mid-tier was already the most competitive band — median sale/original 104.9%, with mid-tier squeeze emerging in Q4.
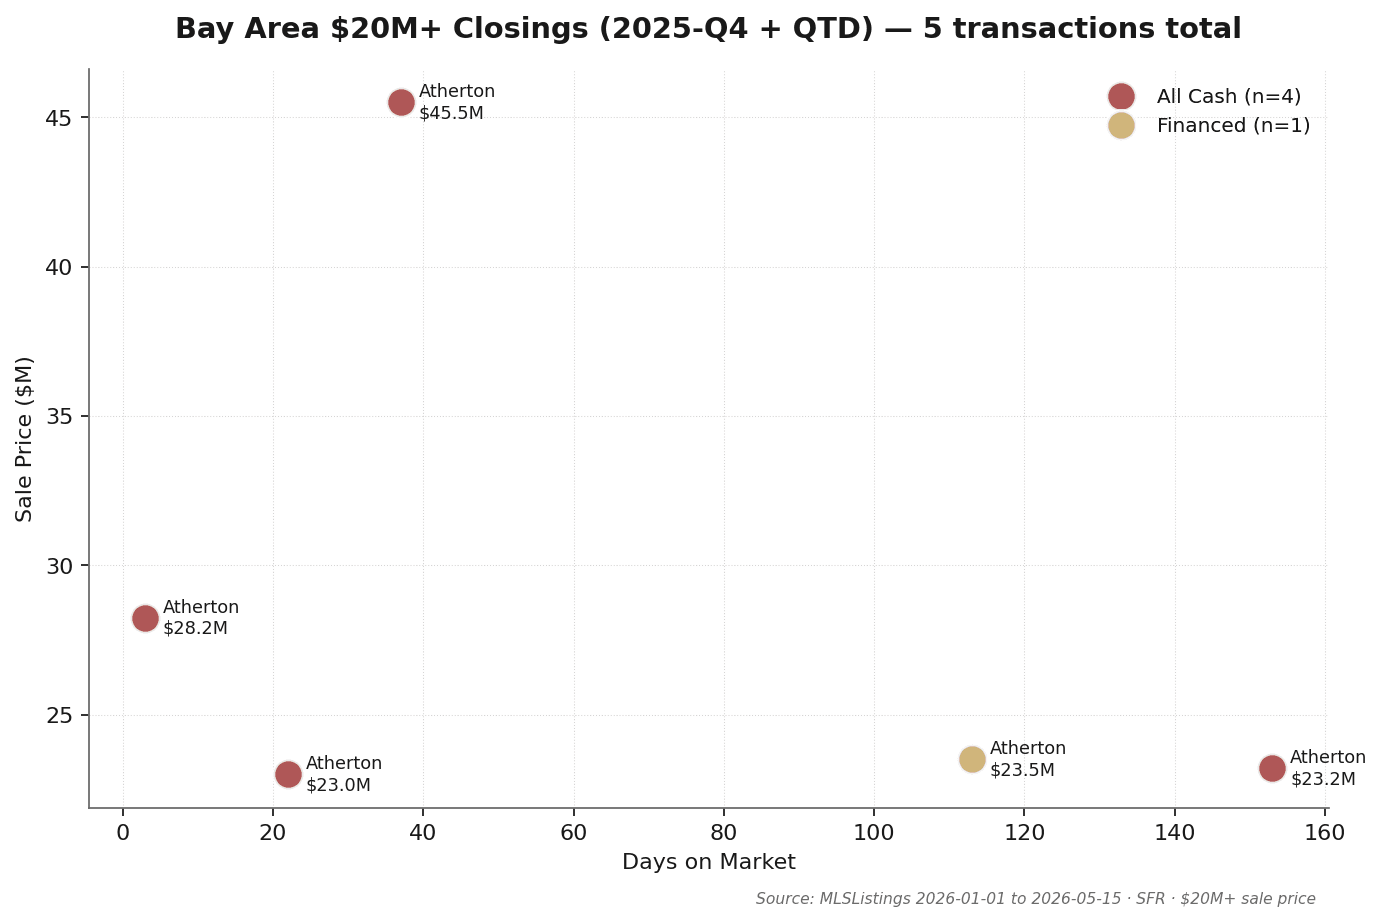
- Ultra-luxury was essentially frozen — only 4 public closings above $20M in the entire Bay Area, all in Atherton, median DOM 75 days.
1. The 30-Second Read
This issue draws on 3,360 single-family residence (SFR) closings across San Mateo, Santa Clara, and Alameda counties in Q4 2025 (CloseDate October 1 through December 31), covering 52 cities. Data sourced from MLSListings and Bay East / Contra Costa AOR.
- Q4 SFR median sale price $1.45M, median days on market 15, median sale-to-list ratio ~102% — seller's market with visible tension, though at a measured pace overall.
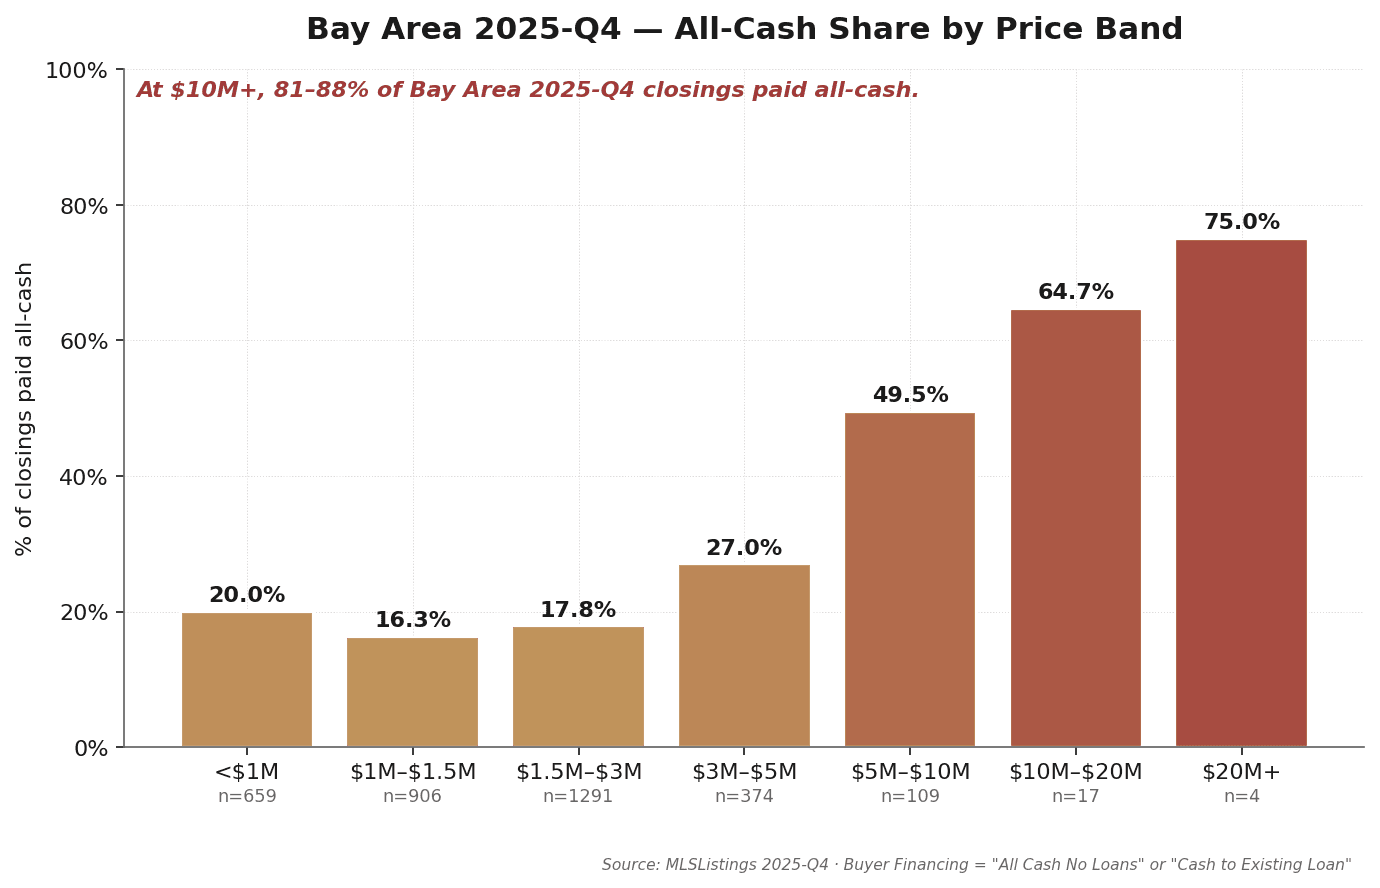
- All-cash share rises step-wise with price: under $1.5M 16–20%; $5M–$10M 50%; $10M–$20M 65%; $20M+ 75%. The $5M threshold is the key inflection point.
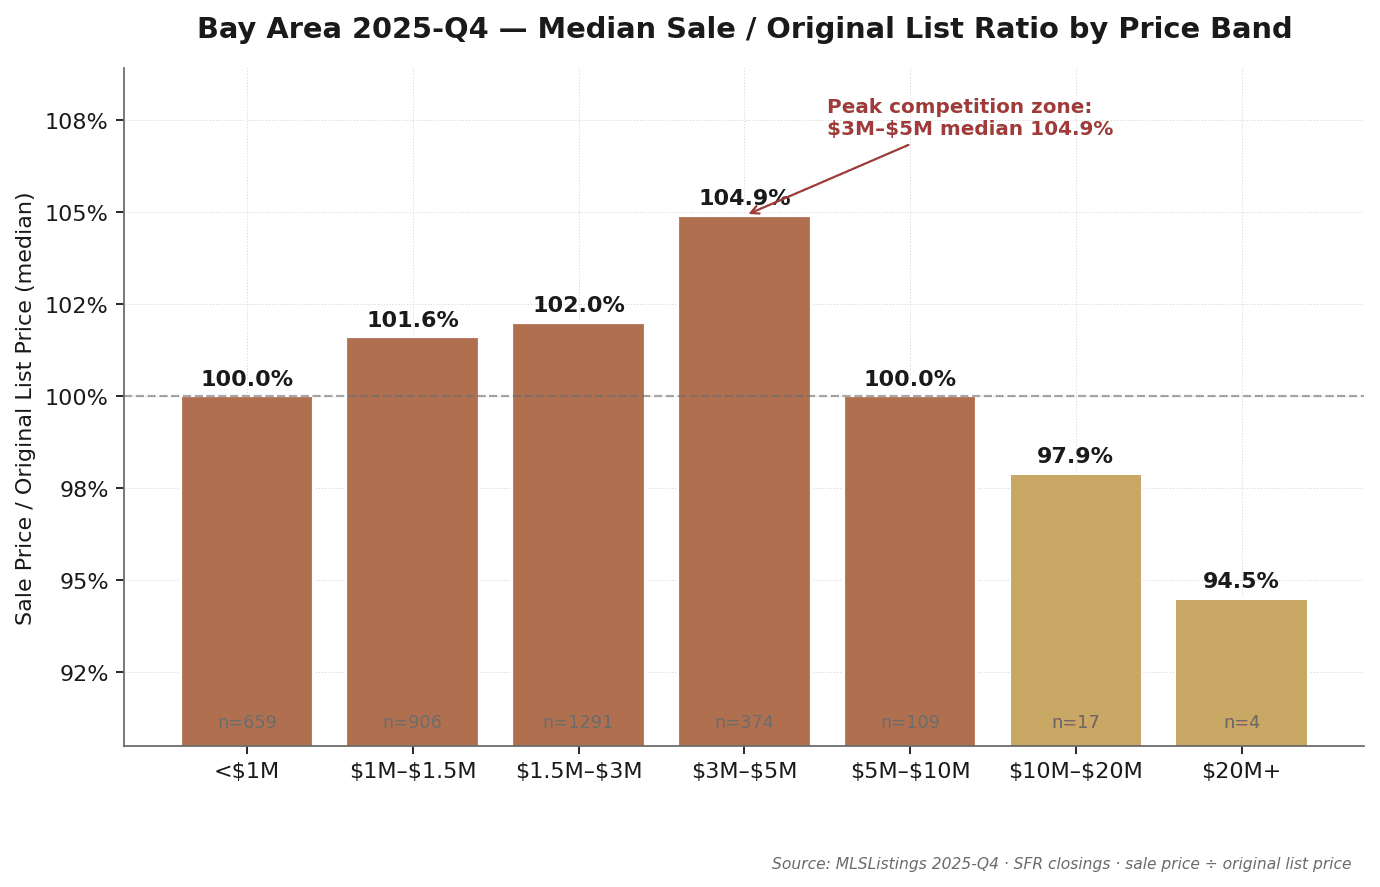
- The most competitive price band is $3M–$5M — median sale-to-original-list ratio 104.9%, above every higher band.
- Only 4 transactions over $20M closed in the entire Bay Area in Q4, all in Atherton, median DOM 75 days and sale/orig near 95%.
- Berkeley stands out: 107 closings with sale/orig 120.6% — the highest of any city in the three-county dataset.
- Macro: Q4 30-yr mortgage rate averaged 6.23% (QoQ −34 bps); S&P 500 +2.4%; Case-Shiller SF HPI QoQ +1.7%.
Source: MLSListings + Bay East / Contra Costa AOR · Q4 2025 SFR closings · MK Group · Field definitions in Section 8.
2. Bay Area Fundamentals: Four Baseline Numbers
Q4 2025 Bay Area SFR market, summarized in four numbers:
| Metric | Q4 2025 Median | Interpretation |
|---|---|---|
| Total closings | 3,360 | San Mateo + Santa Clara + Alameda combined |
| Median sale price | $1.45M | All price bands aggregated |
| Median DOM | 15 days | List date to offer acceptance |
| Median sale-to-list | ~102% | Moderate seller's market |
These four numbers point to one read: Q4 2025 was a structural seller's market — median DOM of 15 days means typical listings took close to two weeks to go under contract; a 2% median premium indicates buyers were bidding modestly above list, with near-list pricing as the baseline. Regional averages mask significant city- and tier-level differentiation explored in the sections below.
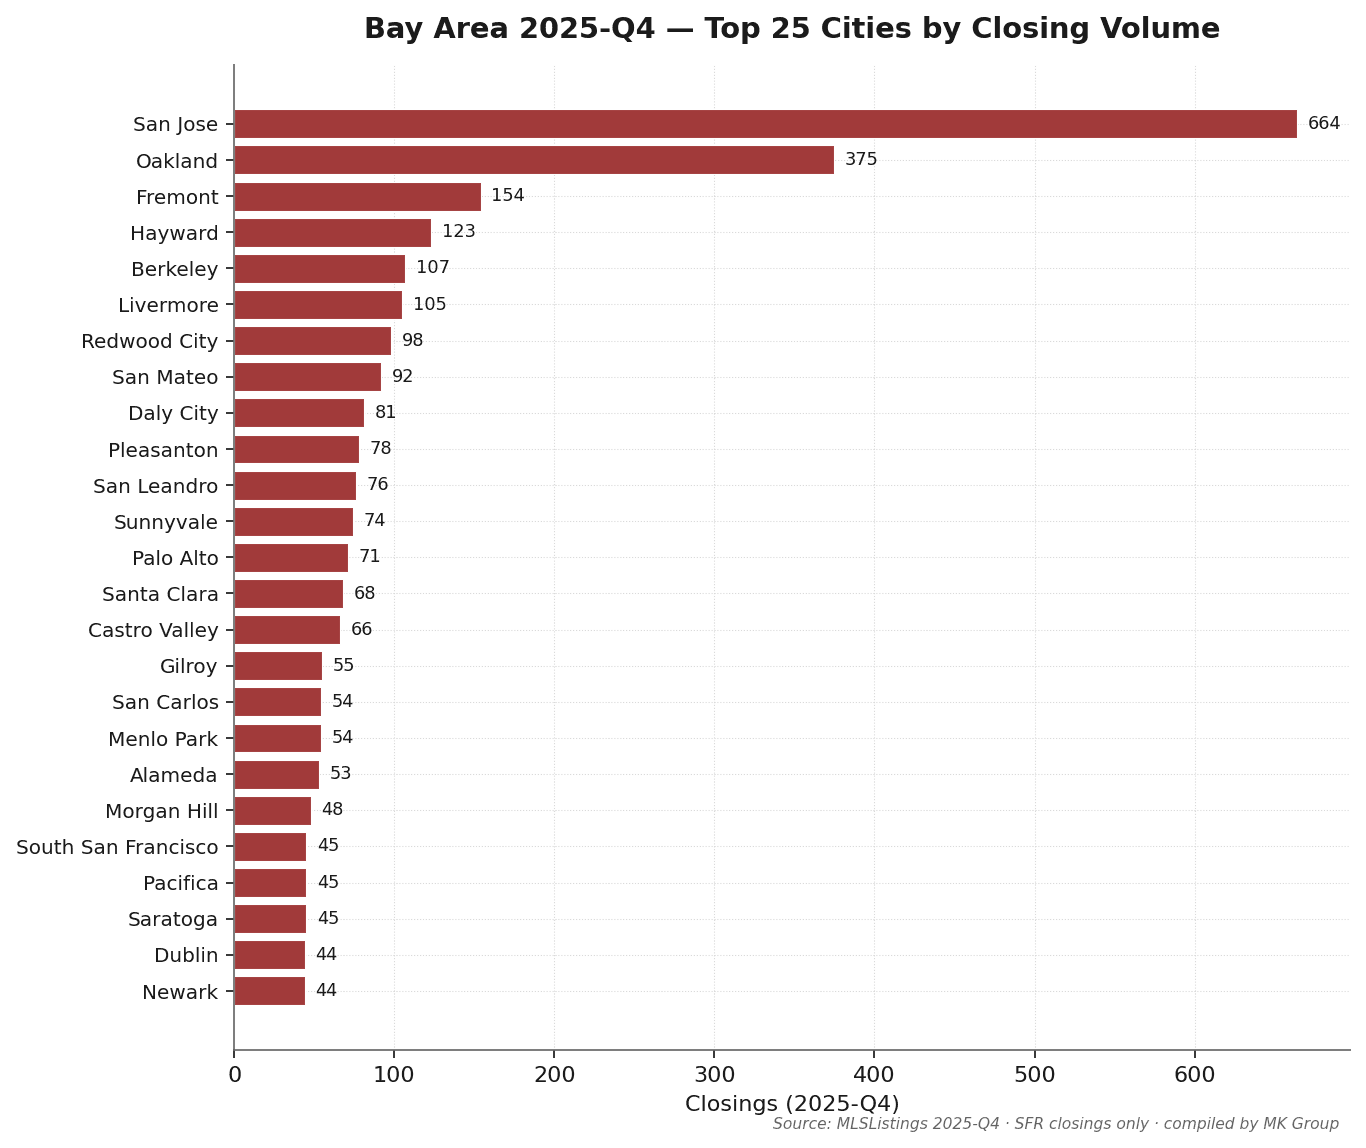
San Jose recorded 664 Q4 closings — 20% of the three-county total. Oakland (375) and Fremont (154) follow. Among MK Group's core service cities: Palo Alto 71, Menlo Park 54, Atherton 18 — low volume, high price.
Source: MLSListings + Bay East / Contra Costa AOR · Q4 2025 SFR closings · excludes condo, multi-family, and records below $100K.
3. The Cash Ladder: Luxury's Decoupling in Progress
| Indicator | This Quarter | vs Prior Q | YoY |
|---|---|---|---|
| 30-yr fixed mortgage avg | 6.23% | −0.34 pp | −0.41 pp |
| 15-yr fixed mortgage avg | 5.49% | −0.21 pp | −0.34 pp |
| 10-yr Treasury yield avg | 4.10% | −0.16 pp | −0.18 pp |
| CA unemployment rate | 5.50% | 持平 | +0.10 pp |
| S&P 500 close (period-end) | 6,845.5 | +2.35% | +16.39% |
| Case-Shiller SF HPI | 361.2 | +1.68% | −0.08% |
Sources: Freddie Mac PMMS / U.S. Treasury / BLS / S&P Global / S&P CoreLogic (via FRED API) · fetched 2026-05-17
Q4 macro backdrop: 30-yr rate fell 34 bps quarter-over-quarter (from 6.57% to 6.23%), 41 bps below a year ago. Equity markets gained 2.4% and Case-Shiller SF HPI rose 1.7% in the quarter. Theoretically, this "falling rates + recovering equity" combination should have stimulated all price tiers. But the luxury tier's response was fragmented — Q4 was an early transition quarter for luxury moving toward full cash dominance.
| Price Band | Closings | Cash % | Median Sale | DOM |
|---|---|---|---|---|
| <$1M | 659 | 20.0% | $808K | 20 |
| $1M–$1.5M | 906 | 16.3% | $1.25M | 15 |
| $1.5M–$3M | 1,291 | 17.8% | $1.94M | 13 |
| $3M–$5M | 374 | 27.0% | $3.67M | 11 |
| $5M–$10M | 109 | 49.5% | $6.43M | 10 |
| $10M–$20M | 17 | 64.7% | $12.40M | 21 |
| $20M+ | 4 | 75.0% | $23.35M | 75 |
Observation 1: Luxury was in an early transition toward full cash dominance
In Q4, the $10M+ tier still had 25–35% financed transactions — $10M–$20M at 64.7% cash, $20M+ at 75% cash. Below $5M, all-cash share was 16–27% and mortgage buyers dominated. The step-wise escalation of cash share with price is the clearest structural signal in the Q4 dataset: $5M is the inflection where cash begins to meaningfully dominate buying behavior.
Observation 2: Luxury DOM was elevated — buyers in wait-and-see mode
Q4 median DOM: $1.5M–$3M band 13 days; $3M–$5M band 11 days; $10M–$20M band 21 days; $20M+ median 75 days. Luxury buyers in Q4 were visibly in "wait and see" mode — the rate decline was a signal but had not yet translated into accelerated deal velocity.
Observation 3: Rates fell, but buyer behavior change lagged
The 30-yr rate dropped 34 bps quarter-over-quarter — a meaningful easing signal. Yet the $1.5M–$3M tier's median DOM stayed at 13 days and sale/original at 102% — a seller's market, but at a measured pace. Rate cuts translate to behavior change with a 1–2 quarter transmission lag; Q4 was the rate-signal accumulation quarter.
Source: MLSListings + Bay East / Contra Costa AOR · Q4 2025 · "Buyer Financing" field = "All Cash No Loans" or "Cash to Existing Loan" = cash · field completeness 98.6%
4. Mid-Tier Turning Point: The $3M–$5M Segment
If the luxury story is a transition, the mid-tier story is early compression.
The data
$3M–$5M: 374 closings, median sale-to-original-list 104.9% — highest of any band. $1.5M–$3M follows at 102.0%. $5M+ bands are all at or below 100% — essentially at ask, no bidding war premium. The inversion is clear: the more expensive the tier above $5M, the lower the competitive premium, while the mid-tier competes most aggressively. Q4's mid-tier compression was already present and visible.
Why the mid-tier tightened first
$3M–$5M is the entry threshold for Bay Area GreatSchools 10/10 districts — Palo Alto Unified (most ZIPs), Cupertino Union core ZIPs, Los Altos/Saratoga mid-tier. The buyer profile is homogeneous: age 30–45, FAANG/AI mid-manager or senior engineer, RSU/pre-IPO equity but limited liquid cash, kids in elementary or middle school with hard school-zone requirements. Existing owners in this band are typically locked into 2018–2022 mortgage rates of 2.5–3.5%; trading up nearly doubles their rate. In Q4, falling rates caused some owners to reconsider listing — but the result was more "considering but not yet on market" than actual new supply. Demand stayed, supply stayed constrained.
Source: MLSListings + Bay East / Contra Costa AOR · Q4 2025 · Sale Price ÷ Original List Price · median (not mean)
5. $20M+ Ultra-Luxury: Four Transactions, Frozen
The entire Bay Area produced 4 public MLS closings above $20M in Q4 2025. All four were in Atherton.
Transaction detail (Q4 2025 · 4 closings, all Atherton)
| Address | Sale Price | Orig List | DOM | Cash | Close Date |
|---|---|---|---|---|---|
| 88 Tuscaloosa Ave | $45.5M | $49.9M | 37 | ✓ | 2025-12-05 |
| 89 Tallwood Ct | $23.5M | $24.0M | 113 | — | 2025-12-19 |
| 30 Adam Way | $23.2M | $25.5M | 153 | ✓ | 2025-11-19 |
| 91 Mandarin Way | $23.0M | $23.5M | 22 | ✓ | 2025-12-02 |
Three observations
1. Four closings, all Atherton — geographic concentration at an extreme. Hillsborough, Los Altos Hills, Woodside, and Palo Alto — all markets with occasional $20M+ closings — registered zero in Q4. Q4's ultra-luxury activity was almost entirely confined to a single city, a degree of geographic concentration that is historically unusual.
2. DOM ranged from 22 to 153 days — median 75 days. Ultra-luxury in Q4 was essentially on hold: sellers listed and waited, buyers were in no hurry, and extended negotiations were the norm rather than the exception.
3. Every closing came in below original list price. Sale/original ranged from approximately 91% to 99%; none exceeded 100%. Sellers were conceding 1–9% on average. This stands in sharp contrast to the $3M–$5M mid-tier (sale/orig 104.9%) — Q4 ultra-luxury was a buyer's market within a broader seller's market.
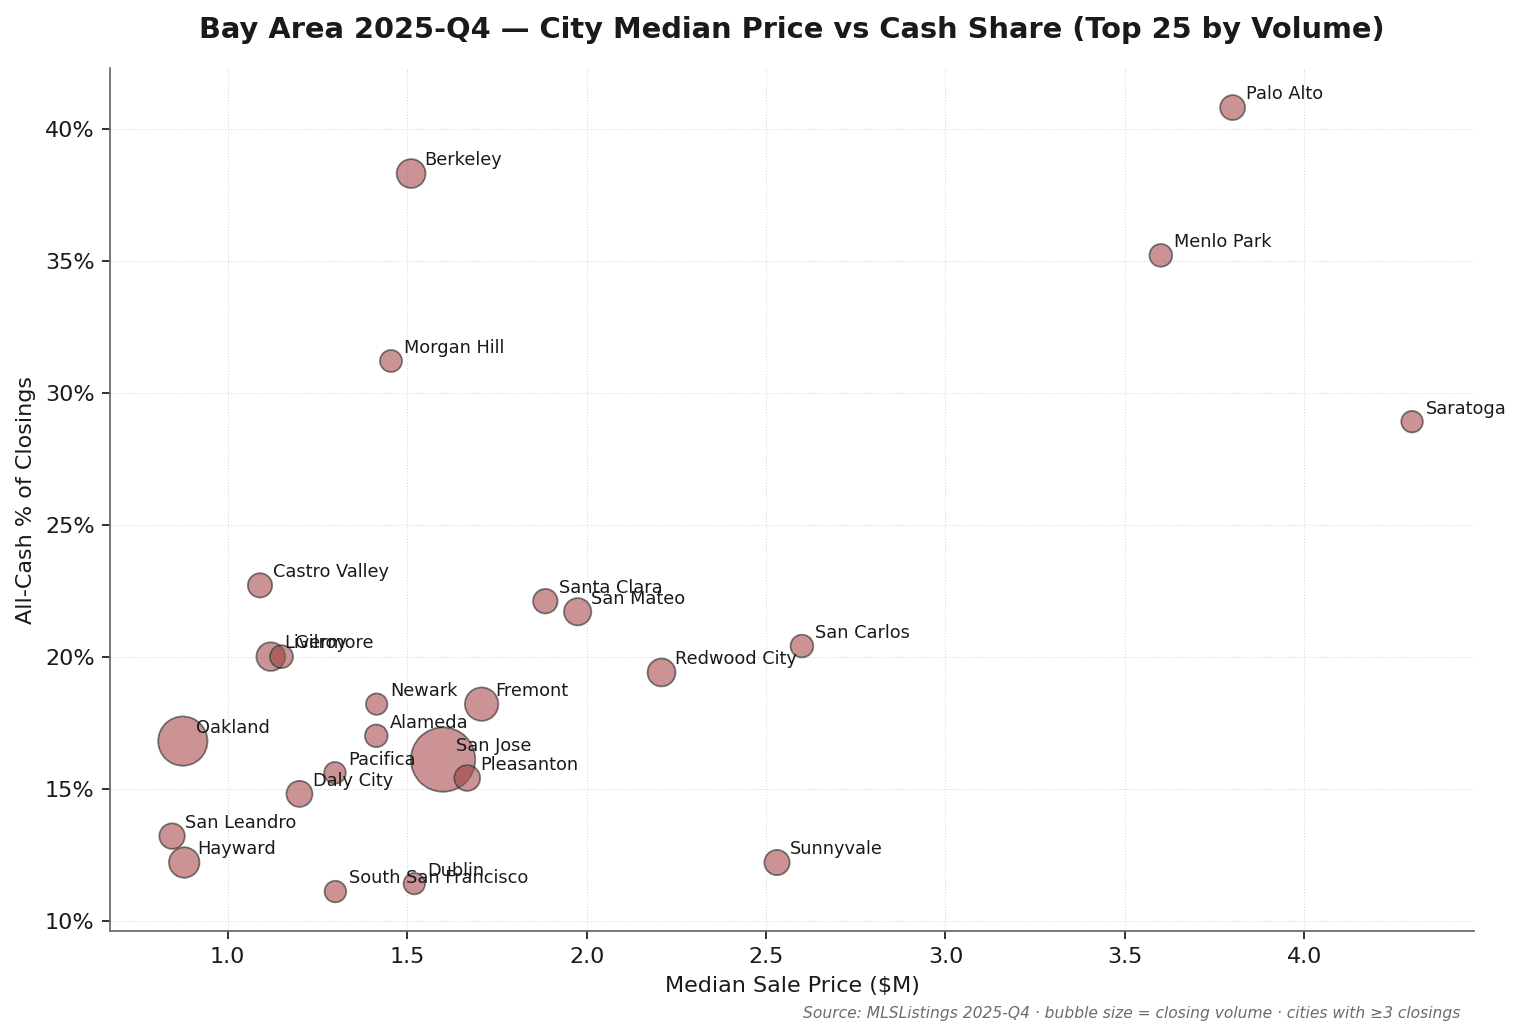
6. City Tiers: Six Groups, Six Narratives
Plotting Q4 data on a city scatter (median price × cash share × volume), the Bay Area resolves into six distinct clusters.
Tier 1 · Ultra-Luxury Anchor (Atherton / Hillsborough / Los Altos Hills)
Median sale price $5M+, all-cash share 50%+, very low volume (fewer than 30 public closings per city per quarter). Q4: Atherton 18 closings at median $10.6M (55.6% cash), Hillsborough 29 at $6.66M (58.6% cash), Los Altos Hills 20 at $5.59M (35% cash). Off-market share is substantial; MLS data understates true activity.
Tier 2 · Premium School-District Core (Palo Alto / Los Altos / Cupertino / Menlo Park)
Median $3M–$5M, 30–45% all-cash, moderate seller's market (sale/list 100–105%). Palo Alto: 71 closings, median $3.8M, 41% cash. Competition is visible with constrained supply driving steady premium formation.
Tier 3 · Tech Corridor Core (Sunnyvale / Mountain View / Santa Clara / Fremont)
Median $1.7M–$2.5M, high FAANG/AI employee concentration. Sunnyvale: 74 closings, median $2.53M, sale/original 107.2% — the tech corridor's most competitive city in Q4, with buyers bidding well above list. Fremont: 154 closings at median $1.71M, the corridor's volume leader.
Tier 4 · Mainstream Housing Market (San Jose / San Mateo / Redwood City / Daly City)
The volume engine of the three-county market. San Jose: 664 closings (20% of Q4 total), median $1.60M, 16% cash. Sale/list 100–103%, DOM 12–15 days — seller's market persists but without Q1's intensity.
Tier 5 · East Bay Expansion (Oakland / Berkeley / Hayward / Pleasanton / Livermore / Alameda)
Widest internal spread of all six tiers. Berkeley: median $1.51M, sale/original 120.6% — the highest of any city in the three-county Q4 dataset. Oakland: median $875K, 375 closings (No.2 by volume). Hayward and Livermore: modest discounts (sale/orig 98–99%). East Bay is effectively its own segmented market.
Tier 6 · Coastal / Outer Suburbs (Pacifica / Half Moon Bay / Gilroy / Morgan Hill / Castro Valley)
Median $1M–$1.5M, DOM 14–32 days (noticeably slower than core), cash share 15–20%. Most mortgage-dependent segment. Gilroy: 32-day median DOM. Half Moon Bay: 21 closings, sale/orig 92.9%. Rate sensitivity is highest here; Q4's 34 bps rate decline will take 1–2 quarters to translate into stronger buyer activity.
City data (20 representative cities)
| City | Count | Median Sale | Cash % | DOM | Sale/Orig % |
|---|---|---|---|---|---|
| San Jose | 664 | $1.60M | 16.1% | 13 | 100.7% |
| Oakland | 375 | $875K | 16.8% | 19 | 104.0% |
| Fremont | 154 | $1.71M | 18.2% | 10 | 101.6% |
| Hayward | 123 | $879K | 12.2% | 17 | 98.9% |
| Berkeley | 107 | $1.51M | 38.3% | 14 | 120.6% |
| Livermore | 105 | $1.12M | 20.0% | 18 | 98.3% |
| Redwood City | 98 | $2.21M | 19.4% | 14 | 101.9% |
| San Mateo | 92 | $1.98M | 21.7% | 12 | 102.3% |
| Daly City | 81 | $1.20M | 14.8% | 15 | 106.7% |
| Pleasanton | 78 | $1.67M | 15.4% | 16 | 97.3% |
| San Leandro | 76 | $845K | 13.2% | 15 | 102.1% |
| Sunnyvale | 74 | $2.53M | 12.2% | 9 | 107.2% |
| Palo Alto | 71 | $3.80M | 40.8% | 10 | 103.3% |
| Santa Clara | 68 | $1.89M | 22.1% | 11 | 104.3% |
| Castro Valley | 66 | $1.09M | 22.7% | 12 | 100.0% |
| Gilroy | 55 | $1.15M | 20.0% | 32 | 97.8% |
| San Carlos | 54 | $2.60M | 20.4% | 12 | 101.8% |
| Menlo Park | 54 | $3.60M | 35.2% | 10 | 100.6% |
| Alameda | 53 | $1.41M | 17.0% | 13 | 108.9% |
| Morgan Hill | 48 | $1.46M | 31.2% | 14 | 100.0% |
Source: MLSListings + Bay East / Contra Costa AOR · Q4 2025 · cities with 3+ closings in quarter (52 cities ranked)
7. Takeaways for Sellers, Buyers, and Cross-Border Investors
For sellers
- Price realistically — Q4 is not a bidding-war environment. Median sale/original at ~102% means most homes close at or near list price. Listing high in hopes of a bidding war will significantly extend DOM in Q4's measured market.
- $5M+ requires 8–10 weeks of pre-listing preparation and serious evaluation of off-market private channels. Luxury median DOM was 21 days in Q4; ultra-luxury 75 days. Conservative pricing and thorough preparation must come before the listing date.
- Watch the rate trajectory — Q4's 34 bps rate decline has begun stimulating mortgage buyer activity. The 25–35% financed share in the $10M+ tier could increase further if rates continue softening. Q4 is the early phase of the rate-decline cycle and the market has not yet fully responded.
For buyers
- Q4 is a relative buyer's market — leverage that timing. Median sale/orig ~102% means near-list pricing is the baseline. At $10M+, sale/orig was 95–98% — below-list offers had real probability of success, especially in ultra-luxury where sellers conceded 2–5% on average.
- Luxury ($5M+): off-market relationships are more valuable than MLS searches. Q4 $10M+ public MLS closings: only 17. True volume is almost certainly higher. Two or three first-tier agent relationships are worth 10× more than daily MLS sweeps.
- School-zone buyers: $3M–$5M was tightening in Q4 but still had a window. Sale/orig of 104.9% means a roughly 5% premium was sufficient. If rates continue softening, mid-tier competition will only intensify — Q4 is a reasonable entry timing.
For cross-border investors
- All-cash advantage is most differentiated at the $5M–$10M tier in Q4. At 49.5% cash, a cash close competes on equal footing with roughly half the buyer pool. At $10M+, cash share of 65–75% means luxury cash is not yet fully dominant, and cross-border cash buyers retain a meaningful relative edge in Q4.
- Establish the holding structure (trust/LLC) before the offer stage. FIRPTA withholding (15% for foreign sellers), estate tax exposure, and FinCEN BOI filing requirements are all costly to restructure post-signing and must be decided upfront.
- Cross-border buyer flow into $5M+ remained active in Q4 2025. MK Group's direct observations confirm continued high-net-worth buyer activity from China, East Asia, and India, with relatively mature compliance pathways (lawful exchange + third-party offshore routing + U.S. escrow).
⚠️ Tax and legal content in this section is for general informational purposes only and does not constitute professional advice. Consult a qualified tax attorney or CPA for your specific situation.
8. Methodology & Definitions
Data source
Core data sourced from MLSListings (primary Bay Area MLS, covering Santa Clara, San Mateo, Santa Cruz, and Monterey counties) and Bay East / Contra Costa AOR (Alameda and Contra Costa counties). The $20M+ tier was individually verified by Marie Wang and Kevin Mo against public closing records.
Coverage
This Q4 2025 issue covers San Mateo + Santa Clara + Alameda — the three counties with highest transaction density and MK Group service concentration. The remaining six Bay Area counties (San Francisco, Marin, Contra Costa, Sonoma, Napa, Solano) are not included in this issue.
Time window
- Q4 primary data: CloseDate [2025-10-01, 2025-12-31], 3,360 records
- This issue does not include a QTD chapter — in-quarter data only per locked scope policy
Property type
Single Family Residential (SFR) only. Condos, multi-family, and land excluded.
All-cash definition
MLSListings "Buyer Financing" field (Bay East equivalent: "SoldTerms") value of "All Cash No Loans" or "Cash to Existing Loan" = cash. All other values = financed. Field completeness: 98.6% in this dataset.
Price band classification
Based on Sale Price (actual close price), not List Price. All medians are statistical medians, not means.
Exclusions
- Status = Cancelled / Expired / Withdrawn: excluded
- Sale Price < $100,000: excluded (likely family/trust/divorce transfers)
Known limitations
- Off-market transactions not on MLS are excluded. Industry estimates suggest $5M+ off-market volume adds 15–25% on top of public counts. The 4-transaction $20M+ figure reflects only public closings; true Q4 volume at this tier may be 50–100% higher (luxury sellers in softer markets skew toward private transactions).
- No YoY comparison in this issue — 2024 Q4 data requires a separate export; the report uses YoY macroeconomic indicators as a partial proxy. Subsequent issues will normalize YoY comparisons.
- School-zone-level breakdowns not included; planned as a new section in a subsequent report.
9. About MK Group
MK Group (Meridian Keystone Real Estate Group) is a Bay Area real estate team based in Cupertino, co-founded by Marie Wang (DRE# 02110980) and Kevin Mo (DRE# 02127623), operating with Keller Williams Realty.
The team focuses on the $3M–$30M+ buy and sell market across the SF Peninsula and South Bay, with deep specialization in cross-border buyer advisory. MK Group combines deep English-language market fluency with native Chinese-language service capability — 68K+ combined YouTube subscribers (@MarieWang 44K+ / @KevinMoRE 24K+), plus Xiaohongshu and WeChat reach.
About the MK Bay Area Pulse Series
Pulse is a quarterly market intelligence report grounded in complete MLS closing data, County Recorder cross-reference, and direct transaction observations from 200+ client engagements. Designed to serve buyers, sellers, investors, media, and researchers who need data-driven, source-transparent, cross-tier Bay Area market analysis.
Citation
Please cite as: "MK Bay Area Pulse 2025-Q4, MK Group"
For high-resolution charts, full dataset, or press inquiries, contact Marie Wang(marie.wang@kw.com) or Kevin Mo(kevin.mo@kw.com), or via mkbayarea.com/contact
2025 series overview
This is the fourth and final issue of the 2025 series. The Q1–Q3 quarterly reports stand alone and are archived at mkbayarea.com/pulse.
Questions about your specific situation?
Data provides context — your decision depends on your timeline, budget, and goals. Reach out to Marie Wang or Kevin Mo directly. First consultation is always free and carries no obligation.