Direct answer
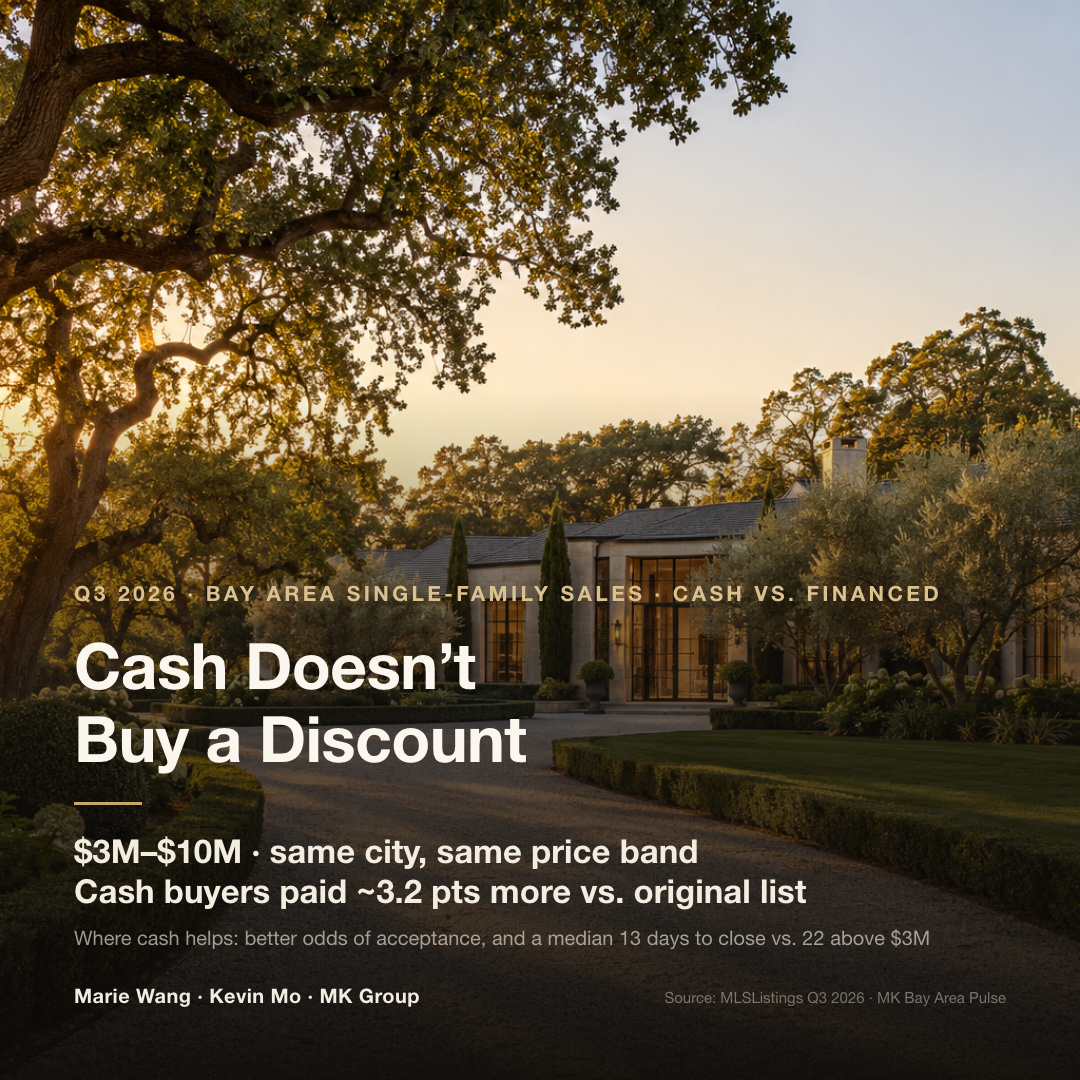
No. Among Q3 2026 single-family closings in three Bay Area counties, all-cash buyers in the $3M–$10M range paid about 3.2 percentage points more than financed buyers — measured as sale price over original list price, and compared within the same city and price band (MLSListings).
Cash reliably bought a discount on one kind of house only: homes under $3 million that had been on the market more than 30 days or had taken a price cut. There, in each of the three quarters studied, cash buyers closed 1.4 to 1.7 points below financed buyers, measured against the final list price. Above $3 million, cash does two other things: it makes the offer more likely to be the one the seller accepts, and it shortens escrow — a median 13 days from pending to close, against 22.
Who this article is for
- Buyers with the full purchase price in hand and a budget from $3 million to $10 million or more, shopping for a single-family home in Palo Alto, Los Altos, Menlo Park, Atherton, Hillsborough, or a neighboring town, who want to know whether an all-cash offer can be negotiated into a discount
- Tech families whose stock or options have just turned liquid — including pre-IPO shares sold on the secondary market — with funds in place and a cash offer in mind
- Cross-border buyers moving funds into the U.S. to buy a Peninsula or South Bay home outright
- Local families who have just sold a home and plan to buy the next one all-cash with the proceeds
- Buyers above $10 million, where most of the competition also pays cash, who want to know what else separates one offer from another
Three things that decide whether cash buys a discount
Whether paying cash earns a lower price comes down to three questions: does anyone else want the house, which price band is it in, and who wrote the other offers on the table. The figures below are MLSListings closings from Q3 2026 and two comparison quarters, Q3 2025 and Q2 2026. Throughout, a "hot listing" is a home that sold within 14 days on market without a price cut; a "stale listing" is one that sat more than 30 days or was reduced. "Sale-to-list ratio" means the median of sale price divided by original list price.
One: on a contested house, cash does not save money
On hot listings between $3 million and $10 million, cash buyers in Q3 2026 closed at a median 110.6% of original list; financed buyers closed at 109.2%. Held to the same city and price band, cash paid 1.89 points more. Q2 2026 ran the same way (108.3% against 107.3%; +1.83 after the city-and-band control). Q3 2025 tilted slightly the other way (105.7% against 106.8%; −0.85 controlled). In two of the three quarters, cash buyers paid more for hot listings.
Part of the reason is that cash buyers crowd onto exactly these homes. In the $5M–$10M band in Q3 2026, cash made up 53.8% of hot-listing sales but only 30.0% of stale-listing sales. Q3 2025 showed 53.5% against 36.6%; Q2 2026, 45.2% against 38.3%. When a house draws several offers and more than one is cash, the seller is weighing price against certainty of closing. Paying cash makes your offer cleaner and faster. It rarely wins anything back on price.
Two: cash moves price only where nobody is competing — and reliably only under $3 million (about 1–2 points)
The data shows a consistent cash discount in one place: stale listings under $3 million. Measured against the final list price — the price after any reductions — cash buyers of these homes closed at a median 97.0% in Q3 2026, against 98.7% for financed buyers, 1.7 points lower. The gap was 1.4 points in Q2 2026 and 1.7 in Q3 2025. Once a seller has waited more than a month, or has already cut the price, an offer that doesn't depend on a loan approval carries real weight at the table. At about 1.5 points, a buyer of a $2 million stale listing would pay roughly $30,000 less (illustrative arithmetic). That band sits below most readers' budgets; it is here for contrast.
Between $3 million and $10 million, the stale-listing discount stops holding. Raw medians put cash 0.3 to 2.2 points lower, but each quarter has only 157 to 178 such sales, and once the comparison is held to the same city and band, the direction flips from quarter to quarter. At this level, when a buyer does negotiate a lower price, the room usually comes from the market itself. Los Altos Hills is one example: of its 28 single-family closings at all price points in Q3 2026, 64% sold below original list (MLSListings). Single-town samples are small each quarter, so read this as direction only.
Three: above $10 million, cash is the entry ticket — terms and fit decide
In Q3 2026, 45 single-family homes above $10 million closed across the three counties, 32 of them all-cash — 71.1%. Cash sales closed at a median 96.0% of original list, financed sales at 96.8% (29 cash and 12 financed sales have complete price fields). Both sides closed 3 to 4 points under the original asking price. When seven in ten buyers pay cash, cash by itself sets no one apart. The difference comes from offer terms, speed of decision, and whether buyer and seller see the house the same way. The sample at this level is small; read it as direction only.
Across everything above $3 million, the consistent difference cash makes is in time to close. In Q3 2026, all-cash sales above $3 million closed a median 13 days after going pending; financed and other terms took 22. A cash offer skips both loan approval and the lender-ordered appraisal. How the escrow calendar is built, and which steps slow down even an all-cash close, is broken down step by step in how long it takes to close on a $5M+ Bay Area home, cash versus loan.
Q3 2026: cash and financed sale prices, side by side
How the data is built: MLSListings closed single-family sales in Santa Clara, San Mateo, and Alameda counties — 5,098 transactions that closed in Q3 2026 (July 1 through September 30), deduplicated under MK Bay Area Pulse pipeline rules, with sales below $100,000 removed. "All-cash" means the MLS sale terms read All Cash, No Loans or Cash to Existing Loan. Everything else — conventional, FHA, VA, private financing, other — is grouped as financed and other.
The headline numbers: of 5,098 single-family closings in Q3 2026, 956 were all-cash, or 18.8%. The cash share climbs sharply above $3 million, reaching 46.0% in the $5M–$10M band and 69.4% at $10M–$20M. On raw medians alone, $5M–$10M cash buyers closed at 105.7% of original list and financed buyers at 100.0%; 24.7% of cash sales closed below original list, against 47.4% of financed sales.
| Price band (single-family, Q3 2026) | Sales | All-cash share | Cash median sale-to-list | Financed median sale-to-list | Cash sales below original list | Financed sales below original list |
|---|---|---|---|---|---|---|
| Under $1M | 852 | 13.6% | 100.0% | 100.7% | 47.3% | 38.0% |
| $1M–$1.5M | 1,364 | 16.9% | 100.0% | 100.7% | 45.3% | 38.7% |
| $1.5M–$3M | 2,057 | 16.6% | 101.6% | 101.6% | 35.0% | 37.9% |
| $3M–$5M | 593 | 25.3% | 107.1% | 105.3% | 22.3% | 31.0% |
| $5M–$10M | 187 | 46.0% | 105.7% | 100.0% | 24.7% | 47.4% |
| $10M–$20M | 36 | 69.4% | 100.0% | 96.8% | 45.5% | 50.0% |
| $20M+ | 9 | 77.8% | 90.7% | 96.2% | 71.4% | 50.0% |
What to take from this: the table does not control for city. Cash buyers may be concentrated in towns like Palo Alto, where homes routinely sell above list, so raw medians fold differences between cities into the comparison. The $10M–$20M band includes only 11 financed sales, and the $20M+ band only 9 sales in total (7 cash, 2 financed). Those two rows show direction, not conclusions.
So the next table compares a different way. Within each city and price band, it subtracts the financed median sale-to-list ratio from the cash median — counting a city-and-band pair only when each side has at least 2 sales — then weights the average by the smaller side's sale count. A Palo Alto cash buyer is measured only against Palo Alto financed buyers in the same band. The numbers first: in Q3 2026, cash paid more in 20 of the 28 comparable pairs between $3 million and $10 million, and the weighted gap was +3.16 points. In the $5M–$10M band, cash paid more in all 10 pairs, by an average of 4.48 points.
| Price group (cash minus financed, same city and band, percentage points) | Q3 2025 | Q2 2026 | Q3 2026 | Q3 2026 comparable pairs (pairs where cash paid more) |
|---|---|---|---|---|
| Under $3M | +0.28 | −0.36 | −0.41 | 77 (36) |
| $3M–$5M | +0.22 | +0.86 | +2.57 | 18 (10) |
| $5M–$10M | −0.17 | +0.99 | +4.48 | 10 (10) |
| $3M–$10M combined | +0.09 | +0.90 | +3.16 | 28 (20) |
| All price bands | +0.25 | +0.02 | +0.45 | 108 (58) |
What to take from this: across these three quarters, no price group between $3 million and $10 million ever showed cash paying meaningfully less. The only negative reading, −0.17 points in the $5M–$10M band in Q3 2025, is small enough to ignore. Under $3 million, cash and financed stayed within half a point of each other — no cash discount in any useful sense. The size of the gap moves with the quarter: the $3M–$10M figure runs from +0.09 to +3.16, and Q3 2026 was the widest of the three. The direction holds: cash did not pay less. At 3.2 points, a cash buyer of a $5 million home paid roughly $160,000 more than a financed buyer in the same city and band (illustrative arithmetic). Above $10 million there were too few comparable pairs (only 3 in Q3 2026) to include in the conclusions.
Separate hot listings from stale ones and the answer changes. On stale listings under $3 million, cash buyers closed 1.4 to 1.7 points below financed buyers in each of the three quarters, measured against final list price. On hot listings between $3 million and $10 million, cash closed at a median 110.6% of original list in Q3 2026, against 109.2% for financed buyers — cash paid more.
| Quarter | Stale listings under $3M (sales) | Stale, cash (sale ÷ final list) | Stale, financed (sale ÷ final list) | $3M–$10M hot listings, cash (sale ÷ original list) | $3M–$10M hot listings, financed (sale ÷ original list) |
|---|---|---|---|---|---|
| Q3 2025 | 1,517 | 96.4% | 98.1% | 105.7% | 106.8% |
| Q2 2026 | 1,074 | 97.9% | 99.3% | 108.3% | 107.3% |
| Q3 2026 | 1,308 | 97.0% | 98.7% | 110.6% | 109.2% |
What to take from this: the cash discount on stale listings under $3 million survives the same-city, same-band control — −2.73, −4.38, and −1.82 points against original list in Q3 2025, Q2 2026, and Q3 2026. It is the only cash discount in this analysis with a stable direction. Move up to stale listings between $3 million and $10 million and raw medians still show cash slightly lower, against final list price: 94.7% against 96.9% in Q3 2025, 97.3% against 97.9% in Q2 2026, and 96.9% against 97.2% in Q3 2026. After the control, though, the readings are −1.46, −0.91, and +1.42 for the same three quarters. The direction swings. At most there is a small edge, and it does not hold steady.
Last, the competition. Among closings above $3 million in the three counties, the all-cash share rose from 27.8% in Q3 2025 to 32.5% in Q3 2026; above $5 million, from 48.0% to 50.9% — now more than half. The table below breaks this out by city, but on an all-price basis that includes sales under $3 million; it is not the cash share above $3 million. On that basis, Hillsborough rose from 38.7% to 51.5%, Menlo Park from 34.0% to 43.2%, and Atherton held roughly flat (62.5% to 61.9%).
| City (single-family, all prices) | Q3 2025 all-cash share | Q3 2026 all-cash share |
|---|---|---|
| Atherton | 62.5% | 61.9% |
| Hillsborough | 38.7% | 51.5% |
| Woodside | 33.3% | 47.8% |
| Menlo Park | 34.0% | 43.2% |
| Los Altos Hills | 51.6% | 42.9% |
| Los Altos | 30.1% | 38.9% |
| Palo Alto | 33.3% | 36.9% |
| San Carlos | 8.6% | 23.9% |
| Burlingame | 25.5% | 19.3% |
What to take from this: the table mixes all price points, including sales under $3 million, so it cannot be read as the luxury-tier cash share; for homes above $3 million, the move from 27.8% to 32.5% is the figure to use. On the all-price basis, the all-cash share rose clearly over the year in Hillsborough, Woodside, Menlo Park, Los Altos, and San Carlos; Palo Alto edged up; Atherton held above 60%; Los Altos Hills and Burlingame declined. Woodside, Atherton, Hillsborough, and Los Altos Hills each record only 16 to 33 sales a quarter, so single-quarter shares swing widely. Taken together — 27.8% to 32.5% above $3 million, 48.0% to 50.9% above $5 million — the odds that a competing offer is also cash are higher than a year ago.
All of this is correlation. The comparison controls for city and price band but not for condition, lot, or school assignment, and cash buyers may simply choose better homes. MLS sale terms are entered by the listing agent, and "all-cash" means no new loan at closing; it does not rule out borrowing afterward. The figures are closed sales from Q3 2026 and two comparison quarters, not a forecast. Full quarterly data by city and price band is in MK Bay Area Pulse, Q3 2026.
What MK Group sees in practice
Three cases from MK Group's practice add to the data from three angles: speed of decision, room to negotiate, and fit on terms.
Speed of decision: a $10M all-cash budget in Palo Alto, lost overnight
In April 2026, a client with a $10 million budget, entirely in cash, toured a benchmark Palo Alto home listed at $10 million. The finishes, materials, and renovation quality all met the client's expectations. The client wanted one more night to think it over; by the next morning, the house was under contract with another buyer. The team's debrief: all-cash is no longer a trump card, because the other side is very likely paying cash too, and at this price a fast decision and firm terms move a seller more than another 1–2% on price. The recommendation for next time was to have inspection reports, disclosures, and proof of funds in hand before walking in, cutting the time from first showing to a signable offer from 24 hours to 4–6.
Room to negotiate: Los Altos Hills, where cash was one condition of three
In late 2025, an employee of a leading AI company sold pre-IPO shares in stages on the secondary market and used the proceeds to buy a Los Altos Hills home all-cash. MK Group handled the negotiation and brought the price down by more than $1 million from the original asking price (the final sale price was not disclosed). The case review credits that room to three things lining up: the seller's timing and frame of mind, the certainty of the buyer's funds, and the right market window. Cash alone did not do it. That matches the data above $3 million: cash supplies certainty of funds, one of the three conditions, and on its own it is not a discount.
Terms and fit: an $18M Atherton purchase won without the highest offer
In May 2026, Marie Wang (DRE# 02110980) and Kevin Mo (DRE# 02127623), acting as buyer's agents, helped a cross-border buyer acquire an $18 million architect-built residence in Atherton, off-market. The buyer could have paid in full but, for personal reasons, chose to finance about $10 million. The seller had no shortage of well-funded all-cash buyers, and this offer was not the highest on the table at the time. The owner felt the buyer matched what the owner was looking for in many respects, asked to meet in person, and accepted the offer that same evening. For buyers holding cash, the takeaway is this: in a price band where most buyers pay cash, what the owner ultimately chose was fit and certainty of execution.
Common mistakes
Mistake one: "Cash is king — pay all-cash and the seller will come down"
Above $3 million, the data points the other way. In Q3 2026, comparing within the same city and price band, all-cash buyers between $3 million and $10 million closed at a sale-to-original-list ratio about 3.2 points higher than financed buyers (+0.09 in Q3 2025 and +0.90 in Q2 2026 — same direction, smaller size). In the $5M–$10M band, cash paid more in all 10 comparable city-and-band pairs (MLSListings). At this level, cash helps an offer get chosen among several; the data shows no price concession in return.
Mistake two: "Cash buyers pay more, so paying cash is a losing move"
That reads correlation as cause. Cash buyers cluster on hot listings: in the $5M–$10M band in Q3 2026, cash made up 53.8% of hot-listing sales and only 30.0% of stale-listing sales, and hot listings draw competing bids that push prices up to begin with. The controlled comparison removes city and price band, but not condition, lot, or school assignment, and cash buyers may simply pick better homes. What cash actually buys is a better chance of being chosen, plus a shorter escrow: all-cash sales above $3 million closed a median 13 days after pending, against 22 for financed and other terms (MLSListings).
Mistake three: "Above $10 million, all-cash is a sure win"
Of the 45 single-family sales above $10 million across the three counties in Q3 2026, 32 were all-cash — 71.1%. Cash sales closed at a median 96.0% of original list, financed at 96.8%; both came in 3 to 4 points under the original asking price (MLSListings). When most of the competition is cash too, cash alone does not separate offers. The $10 million all-cash client above lost a Palo Alto home overnight; in the $18 million Atherton purchase, the offer the owner chose was financed at about $10 million and was not the highest.
Mistake four: "Once a house has sat for a while, cash can push the price way down"
A consistent cash discount shows up only under $3 million. For homes that sat more than 30 days or took a price cut, cash buyers closed 1.4 to 1.7 points below financed buyers in each of the three quarters studied — Q3 2025, Q2 2026, and Q3 2026 (sale price ÷ final list price, MLSListings). For stale listings between $3 million and $10 million, raw medians put cash 0.3 to 2.2 points lower, but each quarter has only 157 to 178 sales, and the direction flips once the comparison is held to the same city and band. At this level, a counteroffer should rest on the home's own listing and price-cut history and on recent sales in the same city and band. Paying cash is one point in your favor, not the argument itself.
Next steps
- Classify the house before you write an offer. A home on market 14 days or fewer with no price cut gets a hot-listing strategy; one on market more than 30 days, or already reduced, gets a stale-listing strategy. The classification tells you whether cash is working for you on selection or on price.
- On a hot listing, turn cash into terms. Have proof of funds ready before showings, read the disclosures and line up inspections in advance, and write a closing date you will certainly meet. On these homes, do not count on cash for a price discount.
- On a stale listing, base the counteroffer on that home's listing and price-cut history and on recent sales in the same city and band. Under $3 million the data shows a stable cash discount; between $3 million and $10 million it does not, so do not build expectations around "I'm paying cash."
- Above $10 million, first find out what the seller cares about — move-out timing, how well they know the buyer, whether it matters that the buyer understands the house — then align your terms and communication with it.
- If you plan to win with cash and borrow part of it back after closing, get the lender's written terms and timing before you write the offer. The rules are laid out in how soon after an all-cash $6M purchase you can borrow some of it back.