This Pulse issue analyzes 5,098 SFR closings across the Bay Area in Q3 2026 (57 cities, 3 counties), with a hard year-over-year comparison against the archived Q3 2025 baseline. Three headline findings: $10M+ closings rose 88% YoY (24 → 45) while total volume fell 4.1%, with the YoY change rising monotonically by price band and 13 financed $10M+ deals despite rates at 6.68%; the $3M–$5M band held a 105.6% sale-to-original ratio — the highest band for a third straight quarter and the only sub-$10M band up QoQ — while every band under $3M fell back to 100.2–101.6%; and $20M+ logged 9 closings totaling $294M, four at $30M+, led by a $70M all-cash Hillsborough sale. Sourced from MLSListings and FRED, with full methodology transparency.
Scroll the PDF for the full report; the web version below adds clickable links and embedded charts.
- $10M+ closings reached 45, up 88% YoY (24 → 45), while total volume fell 4.1% — the YoY change rises monotonically with price band (<$1M −7.6% … $10M+ +88%); with the 30-year rate up a second straight quarter to 6.68%, financed $10M+ deals held at 13, the same as Q2. Leverage is a tool, not a constraint.
- The $3M–$5M band closed at a median 105.6% of original list — the highest band for a third straight quarter and the only sub-$10M band whose premium rose QoQ — while the three bands below $3M fell back to 100.2–101.6% (from 101.3–103.8%) and market-wide sale-to-list slipped from 103.3% to 101.4%. The squeeze narrowed into a single-band island.
- Nine $20M+ closings totaling $294M, four of them at $30M or more (Q2 had none) — Hillsborough’s 3000 Ralston Ave closed at $70M all-cash, but only after a 20.5% cut from its $88M original ask and 141 days on market; the three homes priced to market sold at or above list in 0–7 days. The two-speed market held for a third quarter, with median DOM tightening from 44 to 31 days.
1. The 30-Second Read
This issue draws on 5,098 single-family residence (SFR) closings in the Bay Area during Q3 2026 (CloseDate July 1 through September 30), spanning 3 core counties and 57 cities, sourced from MLSListings. It is the first issue in the series with three consecutive quarters plus two same-quarter years of fully comparable data: QoQ against Q2 2026, YoY against the Q3 2025 baseline archived on the same basis.
- Q3 SFR median sale price $1.61M (+0.5% YoY), median days on market 13 (14 a year ago), median sale-to-list ratio 101.4% (103.3% in Q2) — still a seller's market, but the premium has narrowed from spring's 3% to 1%.
- All-cash share still climbs the price ladder: 14–17% below $3M, 25.3% at $3M–$5M, 46.0% at $5M–$10M, 69.4% at $10M–$20M, 77.8% at $20M+ — nearly identical to Q2. Combined $10M+ cash share over three quarters: 92.6% → 72.3% → 71.1%, settling near seventy percent.
- The most competitive band is $3M–$5M for the third consecutive quarter: median sale-to-original-list 105.6%, median DOM 9 days — and the only band under $10M where the premium is still rising.
- 9 transactions over $20M closed in Q3, totaling $294M, four of them at $30M+. Median DOM 31 days, median sale at 92.4% of original list.
- Atherton Q3: 21 closings, median $12.25M (+58% YoY), sale-to-original 105.4%, median DOM 9 days — the strongest city-wide reading for Atherton in the seven quarters of this series.
- Palo Alto Q3: 103 closings, median $4.20M (+2.4% YoY), 36.9% cash, sale-to-original 107.6% — a third straight quarter at or above 105%, and the highest of the three.
Source: MLSListings Q3 2026 SFR closings (July 1 – September 30) · MK Group · Field definitions in Section 9.
2. Bay Area Fundamentals: Four Baseline Numbers
The Q3 2026 Bay Area SFR market is summarized most accurately by four numbers:
| Metric | Q3 2026 Median | Interpretation |
|---|---|---|
| Total closings | 5,098 | 3 core counties, 57 cities; −4.1% YoY |
| Median sale price | $1.61M | All bands aggregated; +0.5% YoY |
| Median DOM | 13 days | List date to offer acceptance; 14 a year ago |
| Median sale-to-list | 101.4% | Premium narrowed (103.3% in Q2) |
Together these numbers point to one read: Q3 was a quarter of lower volume at flat prices. The 5,098 closings ran 14.2% below spring's 5,941 — a summer-into-fall decline is the seasonal norm, but this year's drop was nearly twice as deep as a year earlier (Q2 → Q3 2025 was −7.4%), and volume turned negative year-over-year (−4.1%). Prices did not follow: the median sale price of $1.61M sits fractionally above a year ago, the Case-Shiller SF index is up 2.2% YoY, and DOM is a day faster than last year. In other words, fewer homes are changing hands, but not because prices are giving way — the signature of a supply-side contraction rather than a demand-side retreat. Region-wide averages mask substantial city- and band-level differentiation, and this quarter's differentiation sorts by rate sensitivity. The remainder of this report unpacks that.
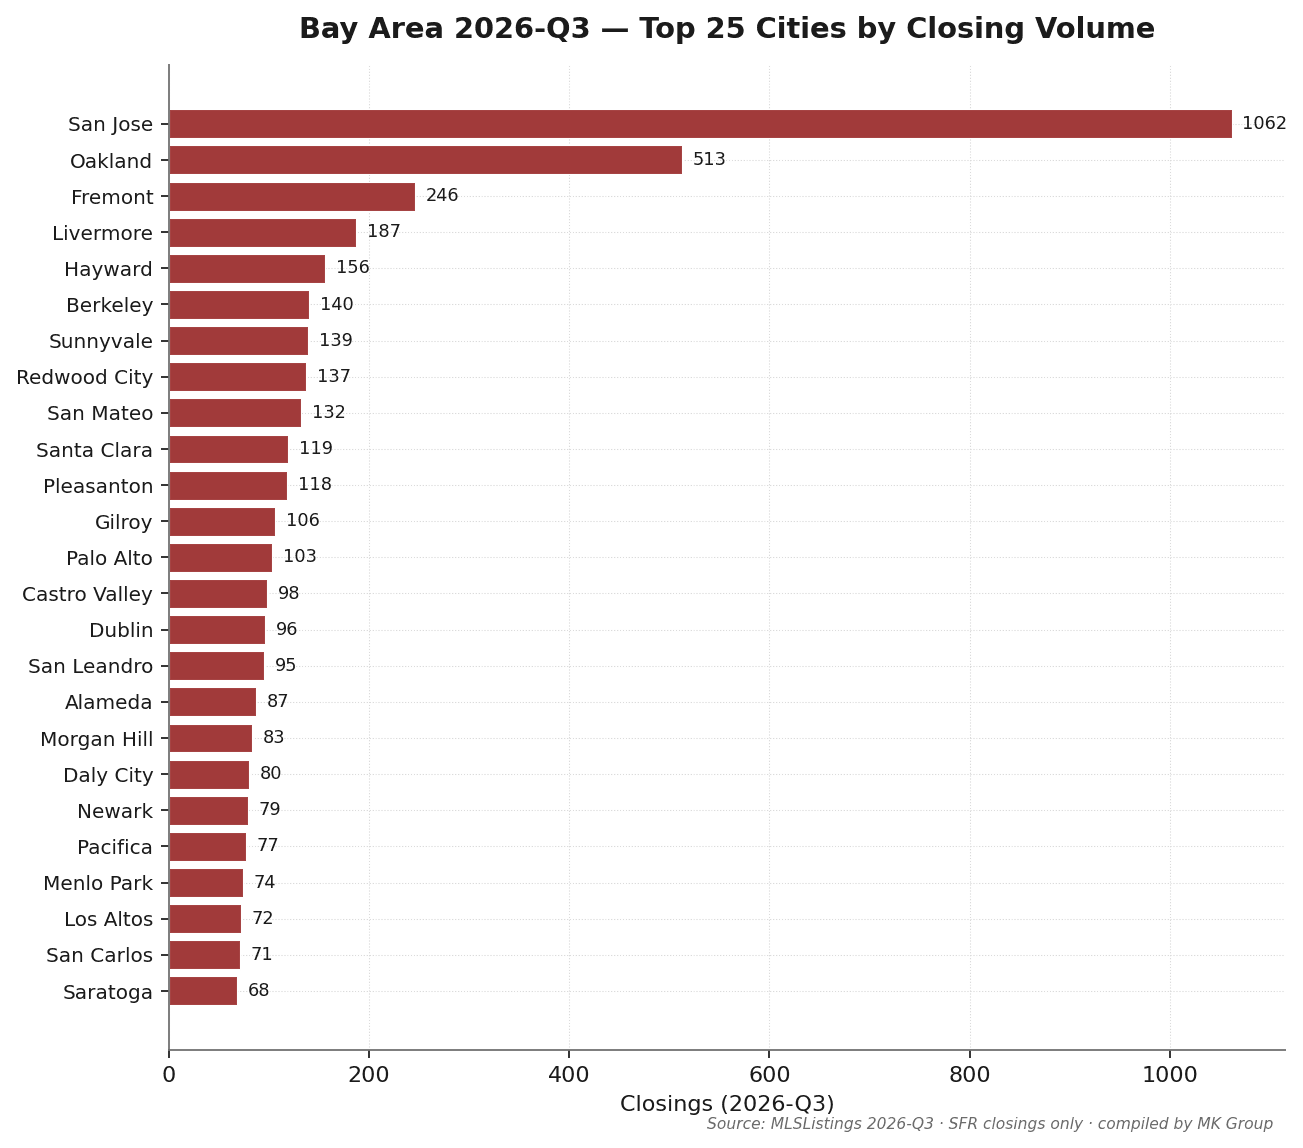
San Jose recorded 1,062 Q3 closings — 20.8% of the regional total. Oakland (513) and Fremont (246) follow. Among MK Group's core service cities: Palo Alto 103, Menlo Park 74, Los Altos 72, Cupertino 59 — low volume but high price.
Source: MLSListings Q3 2026 SFR closings · excludes condo, multi-family, and records with sale price below $100K.
3. YoY Comparison vs Q3 2025: A K-Shaped Staircase Inside a Volume Decline
This is the third Pulse issue with a full year-over-year comparison — the Q3 2025 baseline is archived on the same close-of-escrow basis, so same-quarter comparison neutralizes seasonality by construction. The Q3 2026 vs Q3 2025 story continues the previous two issues' theme in its cleanest form yet: total volume is contracting, luxury is expanding, and the expansion scales monotonically with price. $10M+ closings jumped from 24 to 45 (+88%) while total volume fell 4.1% — the widest gap between the two ends of the K in this series' three YoY comparisons.
| Indicator | Q3 2025 | Q3 2026 | YoY Change |
|---|---|---|---|
| 30-yr fixed mortgage avg | 6.57% | 6.68% | +0.11 pp |
| S&P 500 quarter return | +7.79% | +2.03% | slowed |
| Case-Shiller SF HPI YoY | −0.83% | +2.18% | negative → positive |
| Total in-quarter closings | 5,314 | 5,098 | −4.1% |
| Median sale price | $1.60M | $1.61M | +0.5% |
| $10M+ total closings | 24 | 45 | +88% |
| $5M–$10M closings | 151 | 187 | +24% |
| $3M–$5M median sale/orig | 102.4% | 105.6% | +3.2 pp |
| $10M–$20M cash share | 68.4% | 69.4% | +1.0 pp |
| $5M–$10M cash share | 43.7% | 46.0% | +2.3 pp |
| $3M–$5M cash share | 21.8% | 25.3% | +3.5 pp |
| $20M+ closings | 5 | 9 | +80% |
| $20M+ median DOM | 65 days | 31 days | −34 days |
| $20M+ median sale/orig | 82.4% | 92.4% | +10.0 pp |
Sources: MLSListings Q3 2025 (archived) & Q3 2026 · Cash definition aligned across both periods (Buyer Financing = "All Cash No Loans" or "Cash to Existing Loan") · Rate change computed on unrounded weekly averages · Both years' $20M+ samples are under 10 transactions; interpret ratios with caution.
1. The K-shape became a monotonic staircase: year-over-year volume change by band — <$1M −7.6%, $1M–$1.5M −6.5%, $1.5M–$3M −5.2%, $3M–$5M +0.9%, $5M–$10M +24%, $10M–$20M +89%, $20M+ +80%. The higher the band, the faster the growth, with almost no exception across seven bands. The previous two issues called the K-shaped split a structural fact; Q3 drew it as a straight line from lower-left to upper-right.
2. The mid-tier premium widened year-over-year: $3M–$5M median sale-to-original rose from 102.4% to 105.6% (+3.2 pp), while the whole market moved only from 100.1% to 101.4% (+1.3 pp); the band's cash share rose 3.5 pp alongside. The Q3 2025 issue described this band as "moderate but persistent tension"; a year later it leads the next band by four full points.
3. $20M+ recovered from clearance pricing — and financing arrived: Q3 2025's $20M+ market was "5 closings, 65 days, 82.4%, 100% cash"; Q3 2026's is "9 closings, 31 days, 92.4%, 77.8% cash". Nearly double the closings, half the DOM, ten points less discount — and financed deals above $20M for a second straight quarter (two this quarter, including the series' largest financed closing at $33.25M).
4. The Cash Ladder: Stratification Under Rising Rates
| Indicator | Quarter | vs Prev Q | YoY |
|---|---|---|---|
| 30-yr fixed mortgage avg | 6.68% | +0.26 pp | +0.11 pp |
| 15-yr fixed mortgage avg | 6.02% | +0.26 pp | +0.32 pp |
| 10-yr Treasury yield avg | 4.76% | +0.33 pp | +0.49 pp |
| CA unemployment rate | 5.10% | −0.17 pp | −0.40 pp |
| S&P 500 close (period-end) | 7,651.5 | +2.03% | +14.40% |
| Case-Shiller SF HPI | 362.9 | +0.41% | +2.18% |
Sources: Freddie Mac PMMS / U.S. Treasury / BLS / S&P Global / S&P CoreLogic — via FRED API · fetched 2026-10-10
First, the Q3 macro context (above): the 30-year fixed rate rose for a second consecutive quarter to a 6.68% quarterly average (Q1 6.11% → Q2 6.41% → Q3 6.68%), the 10-year Treasury climbed to 4.76% (+33 bps QoQ), the S&P 500 added just 2.0% after Q2's 14.9% surge, and the Case-Shiller SF index ran +2.2% YoY. Three quarters, three regimes — Q1 "rates down, stocks down", Q2 "rates up, stocks sharply up", Q3 "rates still rising, stocks flat". Q3's combination is the least friendly to mortgage buyers, which makes it a natural experiment in which bands actually depend on a mortgage.
| Price band | Closings | Cash % | Median sale | DOM |
|---|---|---|---|---|
| <$1M | 852 | 13.6% | $825K | 16 |
| $1M–$1.5M | 1,364 | 16.9% | $1.25M | 14 |
| $1.5M–$3M | 2,057 | 16.6% | $1.94M | 13 |
| $3M–$5M | 593 | 25.3% | $3.68M | 9 |
| $5M–$10M | 187 | 46.0% | $6.21M | 9 |
| $10M–$20M | 36 | 69.4% | $12.00M | 20 |
| $20M+ | 9 | 77.8% | $28.50M | 31 |
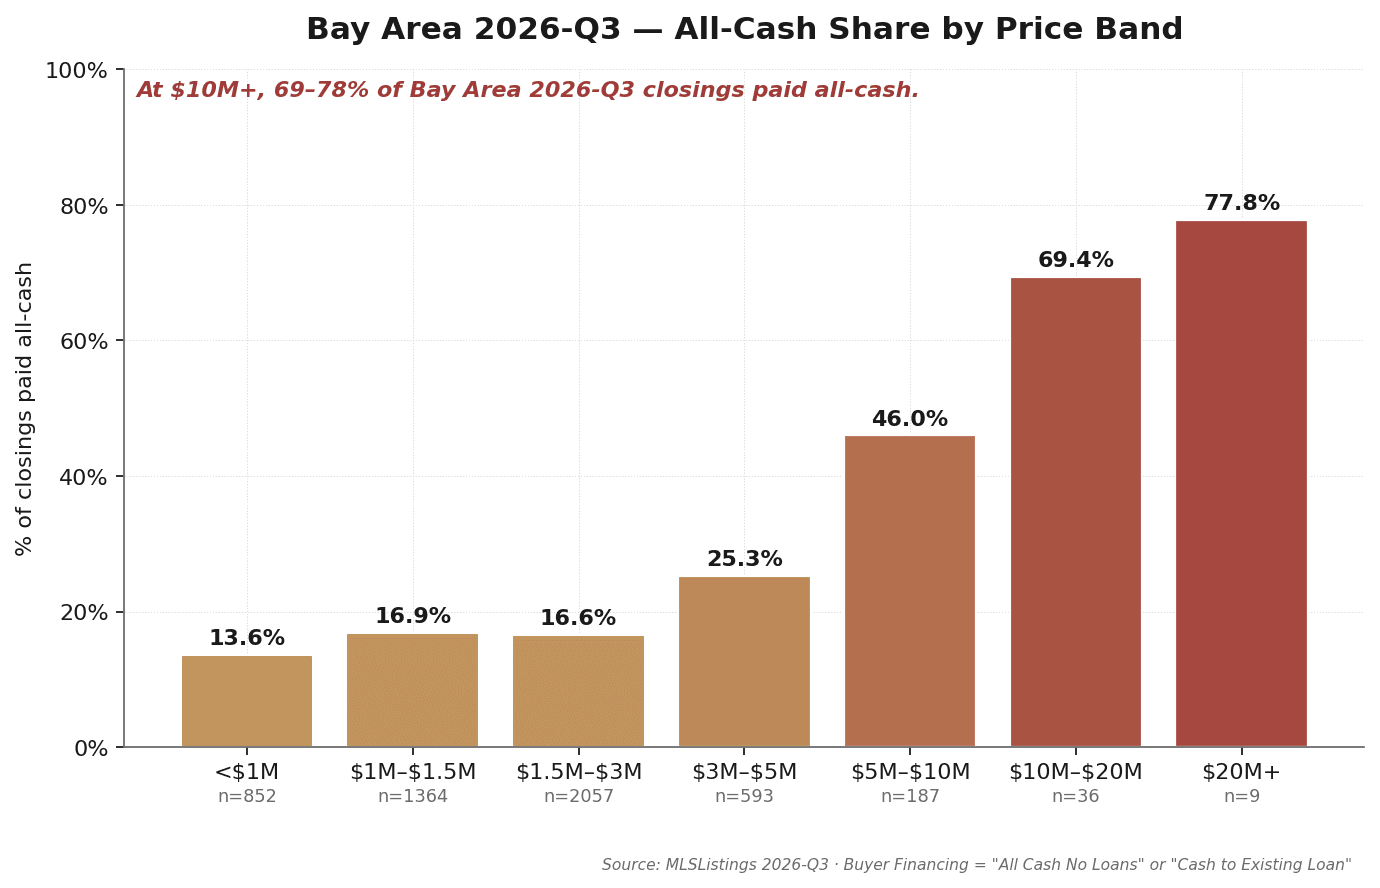
Observation 1: the ladder held for a third quarter; $5M is still the phase line
From 17% in the $1.5M–$3M band to 25% at $3M–$5M, 46% at $5M–$10M and 69–78% at $10M+ — the stepwise structure is unchanged, and $5M remains the phase line in buyer capital structure (25% → 46%, nearly doubling in one step). After Q1's 92.6% pulse at the top, combined $10M+ cash share ran 72.3% in Q2 and 71.1% in Q3 — settling near seventy percent. Last issue we judged Q1's cash majority "a pulse, not a new normal"; Q3 confirms it.
Observation 2: rates rose, and leverage did not leave the luxury tier
Of 45 $10M+ closings, 13 were financed (28.9%) — essentially identical to Q2's 13 (27.7%). In $5M–$10M, 101 of 187 closings were financed (54.0%, vs 55.6% in Q2) — a majority of buyers in this band used loans for a second consecutive quarter. What makes this notable is that Q3's macro backdrop was the opposite of Q2's: rates +26 bps, the 10-year +33 bps, equities up just 2%. Last issue we attributed the return of leverage to the opportunity cost of selling stock during a rally; in Q3 the rally stalled and borrowing got dearer, yet the financed share did not move. At minimum, the return of leverage was not a one-quarter artifact of the Q2 equity surge — it reads as a stable cost-of-capital preference in this buyer cohort.
Observation 3: the cooling landed precisely where mortgages dominate
Compare each band's median sale-to-original with Q2 and the dividing line is as sharp as a ruler: <$1M 101.3% → 100.2% (−1.1 pp), $1M–$1.5M 103.2% → 100.4% (−2.8 pp), $1.5M–$3M 103.8% → 101.6% (−2.2 pp). Buyers in those three bands are 83–86% mortgage-financed; the spring premium was handed back in full at 6.68%, and DOM lengthened by 1–2 days in each. By contrast: $3M–$5M 105.3% → 105.6% (+0.3 pp), $10M–$20M 96.3% → 100.0% (+3.7 pp, the band's first at-list reading in the seven quarters of this series), $20M+ 91.5% → 92.4%. The market's price response to rates appeared almost exclusively in the mortgage-dependent bands.
Observation 4: a second stress test of the "credit decoupling" thesis
Last issue we refined the luxury-tier thesis to: rates never decide whether they buy, only how they pay — luxury's use of credit is opportunistic, not dependent. Q3 was the second consecutive quarter of rising rates: $10M+ volume was flat QoQ (47 → 45) and +88% YoY, so the volume-insensitivity half of the thesis held; the financed share was unchanged, so the payment half held too. After two stress tests, the formulation can stand as this series' baseline: transaction volume above $10M is set by the house and the buyer's balance sheet, not by Freddie Mac's weekly survey.
Source: MLSListings Q3 2026 · Buyer Financing field "All Cash No Loans" or "Cash to Existing Loan" classified as cash · field completion rate 98.9%.
5. The Mid-Tier Squeeze: The $3M–$5M Island
If Q2's mid-tier story was "more supply didn't loosen the squeeze", Q3's is "everything around it cooled, and it didn't".
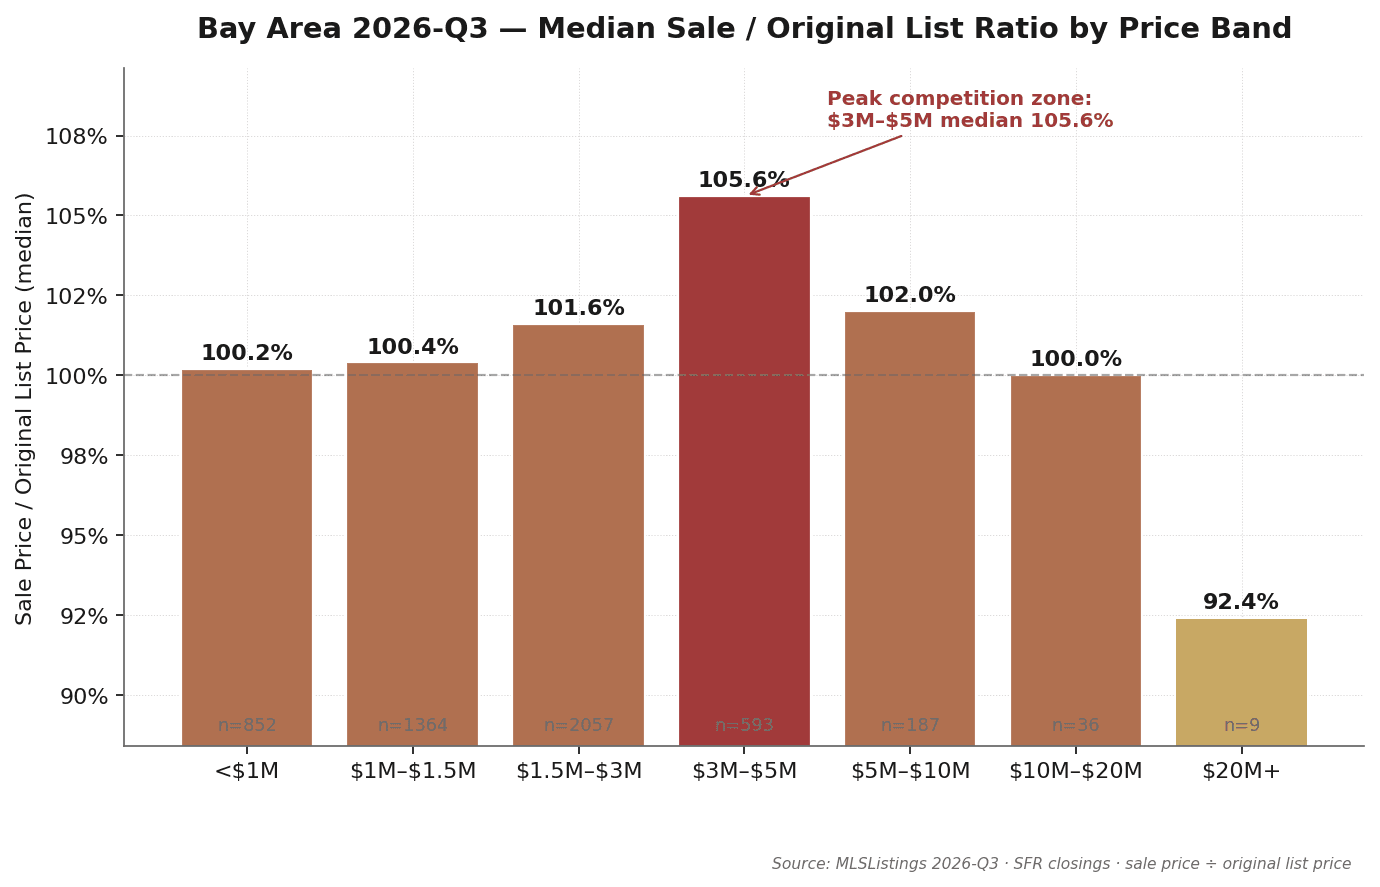
The data
The $3M–$5M band recorded 593 Q3 closings (−28% QoQ, +0.9% YoY) at a median sale-to-original-list ratio of 105.6% — the highest of any band for the third quarter running (in fact for six consecutive quarters back to Q2 2025) — with median DOM of 9 days, tied with $5M–$10M for fastest. Its lead over the $1.5M–$3M band (101.6%) widened from 1.5 points in Q2 to 4.0 points. Together these two bands account for 2,650 transactions, 52% of Q3 volume — but this quarter only the more expensive half is still closing at a meaningful premium. By contrast: $5M–$10M slipped from 103.8% to 102.0%, $10M–$20M closed at 100.0%, and $20M+ at 92.4%. $3M–$5M is the only one of the five bands under $10M whose ratio rose quarter-over-quarter.
Why the neighbors cooled and this band didn't
Q3's rate environment (a 6.68% quarterly average for the 30-year fixed, the highest since Q2 2025) passed through to each band with different force, and the difference is buyer capital structure. Bands below $3M are 83–86% mortgage-financed: payment sensitivity to rates translates directly into a bid ceiling; the 3–4% spring premium was consumed by the rate in Q3, DOM lengthened 1–2 days and sale-to-original fell 1–3 points in each of the three bands. $3M–$5M runs 25.3% cash (+3.5 pp YoY), and the remaining buyers are largely equity-rich dual-income tech households with high down payments and loans that are small relative to price — the rate's effect on the monthly payment is diluted by the down payment; more important is the inelasticity of the demand, since this band is the entry price for the strongest school zones (most Palo Alto Unified ZIPs, core Cupertino Union, mid-tier Los Altos, Menlo Park and Burlingame) and these buyers are working to a school calendar, not waiting on rates. Supply-side rate lock-in tightened further in Q3: the gap between incumbent owners' 2.5–3.5% rates and a 6.68% replacement widened another 26 bps, and once spring's non-discretionary sellers (estates, relocations) seasonally thinned out, this band's supply depended more than ever on the few who have to sell.
Geographically, the premium sits in the band's home cities: Palo Alto 107.6%, Burlingame 107.9%, Mountain View 106.2%, San Carlos 105.0%, Sunnyvale 104.9%, Los Altos 104.8%, Menlo Park 104.3% — all holding at 104–108% — while the $1.5M baseline cities of San Jose (100.0%), Fremont (100.4%) and Santa Clara (101.7%) are back at list.
Why $5M+ behaves differently
The $5M–$10M band closed at a median 102.0% of original list — nearly four points below $3M–$5M and down 1.8 pp from Q2. Owners there have stronger move motivations (upgrades, empty nests, retirement) and far less rate sensitivity, so supply is comparatively healthy and bidding intensity lower; this quarter Hillsborough (100.1%), Los Altos Hills (98.0%) and Woodside (98.2%) — cities with $4M–$7M medians — all closed near list.
Source: MLSListings Q3 2026 · Sale Price ÷ Original List Price, median (not mean).
6. $20M+ Ultra-Luxury: Nine Closings, $294M, Four Above $30M
Nine SFR transactions above $20M closed across the Bay Area in Q3 2026 — one more than Q2, and nearly double Q3 2025's five. The bigger change is magnitude: the nine total $294M (Q2's eight totaled $189M), and four closed at $30M or more — Q2 had none, and Q3 2025 had only Woodside's 329 Albion Ave at $85M. Geography also re-dispersed from Q2's single-city market (six of eight in Atherton): Atherton 4, Hillsborough 2, and one each in Los Altos Hills, Palo Alto and Portola Valley.
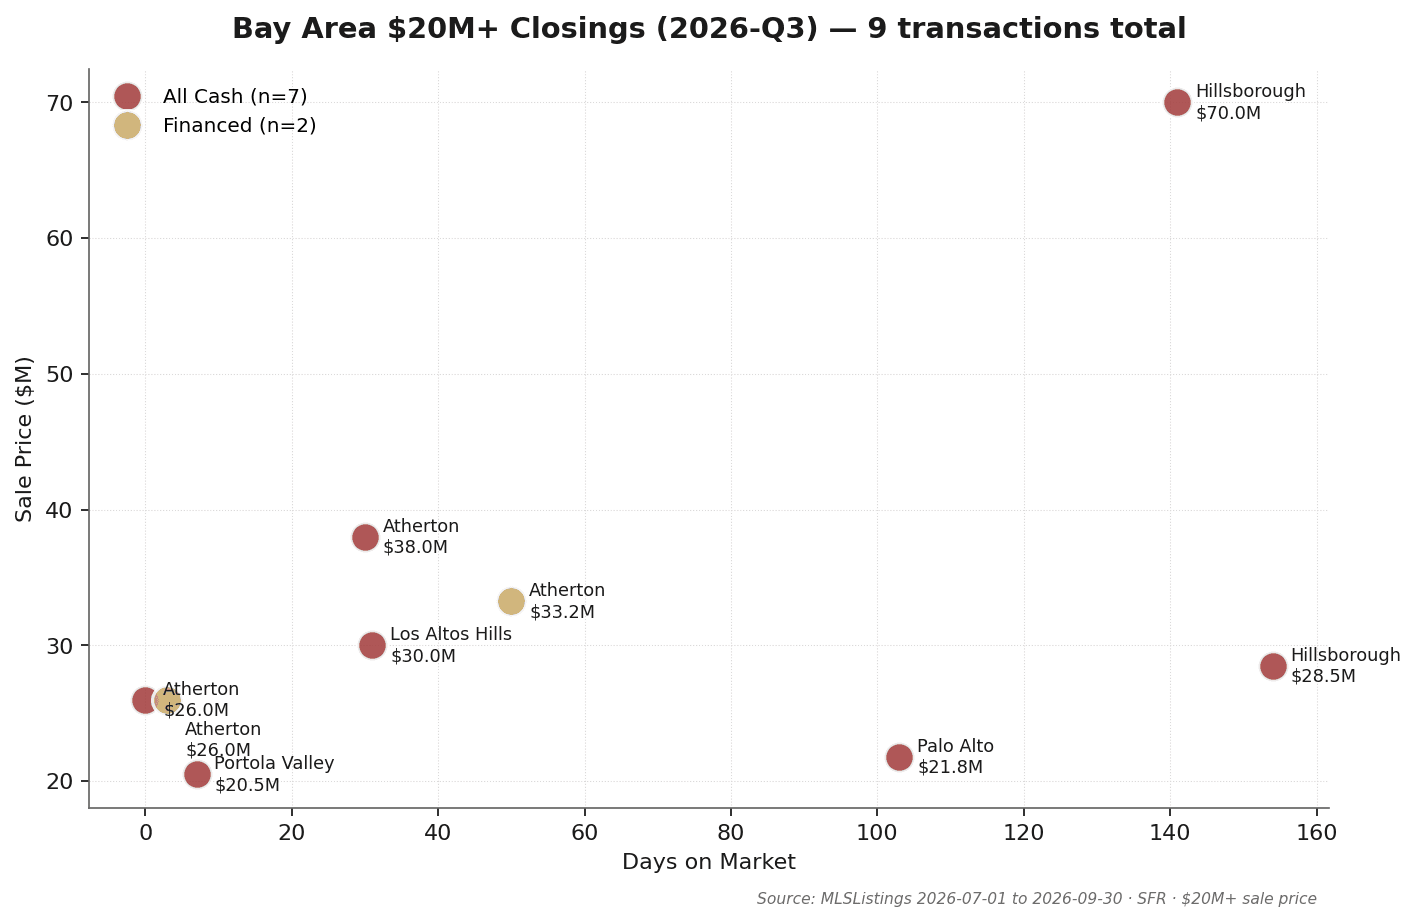
Transaction detail (in-quarter · 9 closings)
| City | Address | Sale | Orig List | DOM | Cash | Close |
|---|---|---|---|---|---|---|
| Hillsborough | 3000 Ralston Ave | $70.00M | $88.00M | 141 | ✓ | 2026-08-06 |
| Atherton | 178 Atherton Ave | $38.00M | $39.95M | 30 | ✓ | 2026-08-26 |
| Atherton | 112 Almendral Ave | $33.25M | $35.99M | 50 | — | 2026-07-20 |
| Los Altos Hills | 27500 La Vida Real | $30.00M | $37.00M | 31 | ✓ | 2026-07-10 |
| Hillsborough | 100 New Place Rd | $28.50M | $35.00M | 154 | ✓ | 2026-08-14 |
| Atherton | 97 Isabella Ave | $26.00M | $25.00M | 0 | ✓ | 2026-08-19 |
| Atherton | 351 Walsh Rd | $26.00M | $26.00M | 3 | — | 2026-07-13 |
| Palo Alto | 2001 Bryant St | $21.78M | $24.00M | 103 | ✓ | 2026-07-20 |
| Portola Valley | 479 Westridge Dr | $20.50M | $20.00M | 7 | ✓ | 2026-08-04 |
YoY note: Q3 2025 recorded just 5 closings above $20M at a median DOM of 65 days, median sale/orig of 82.4% and 100% cash; Q2 2026 ran 8 / 44 days / 91.5% / 75% cash. This quarter's 9 / 31 days / 92.4% / 77.8% cash is faster than either comparison period, with a discount in line with Q2. Both years' samples are under 10 transactions; interpret ratios with caution.
Three observations
Observation 1: the change is in magnitude, not count. Nine closings versus eight is one more transaction, but the median sale jumped from $22.4M to $28.5M and total dollar volume rose 56%. Hillsborough's 3000 Ralston Ave closed at $70M all-cash — the largest sale in this series since Woodside's $85M in Q3 2025 — and returned Hillsborough to the $20M+ list after a year's absence (two closings this quarter; city-wide, Hillsborough logged 33 closings at a $6.60M median, +29% YoY). Atherton fell from six closings to four, but all four closed at $26M or above, two of them above $30M.
Observation 2: the two-speed market held for a third quarter, and the slow lane's discounts got deeper and dearer. The fast lane was three homes — 97 Isabella Ave (4.0% over original list, DOM 0), 479 Westridge Dr (2.5% over, 7 days), 351 Walsh Rd (at list, 3 days) — all gone within a week; a DOM of zero typically means the buyer was in place before the listing. The slow lane was six homes that closed at 79.5–95.1% of original list after an average of 85 days on market. The new feature this quarter is that the three deepest discounts were on three of the most expensive homes: $70M (original ask $88M, an $18M cut), $30M in Los Altos Hills (original $37M, $7M), $28.5M in Hillsborough (original $35M, $6.5M) — a combined $31.5M below original list. 3000 Ralston Ave reduced its ask from $88M to $78.8M over 141 days and still closed at 79.5% of the original. The more ambitious the list price, the larger the eventual concession — and at $30M+, where comparable sales barely exist, that holds with particular force.
Observation 3: seven of nine all-cash — and one of the two financed deals is the largest financed closing in this series. The financed closings were 112 Almendral Ave in Atherton ($33.25M, 50 days, 92.4% of original list) and 351 Walsh Rd ($26.00M, at list in 3 days). The first sets a new high-water mark for financed transactions in this series (the previous high was 250 Atherton Ave at $29.03M in Q2 2025). Using credit at $30M+ says the same thing as Section 4's band-level statistics: at this level, leverage is a treasury choice, not a sign of constrained funds. The off-market caveat stands: these nine are MLS-recorded; industry estimates put unlisted activity at another 15–25% of public volume in this tier.
7. City Tiers: Six Groups, Six Narratives
Plotting Q3 data by city (median price × cash share × volume) surfaces the same six city groups as the previous two quarters — the framework holds, and this quarter the movement inside the tiers runs in one consistent direction: the more mortgage-dependent the city, the more visible the cooling.
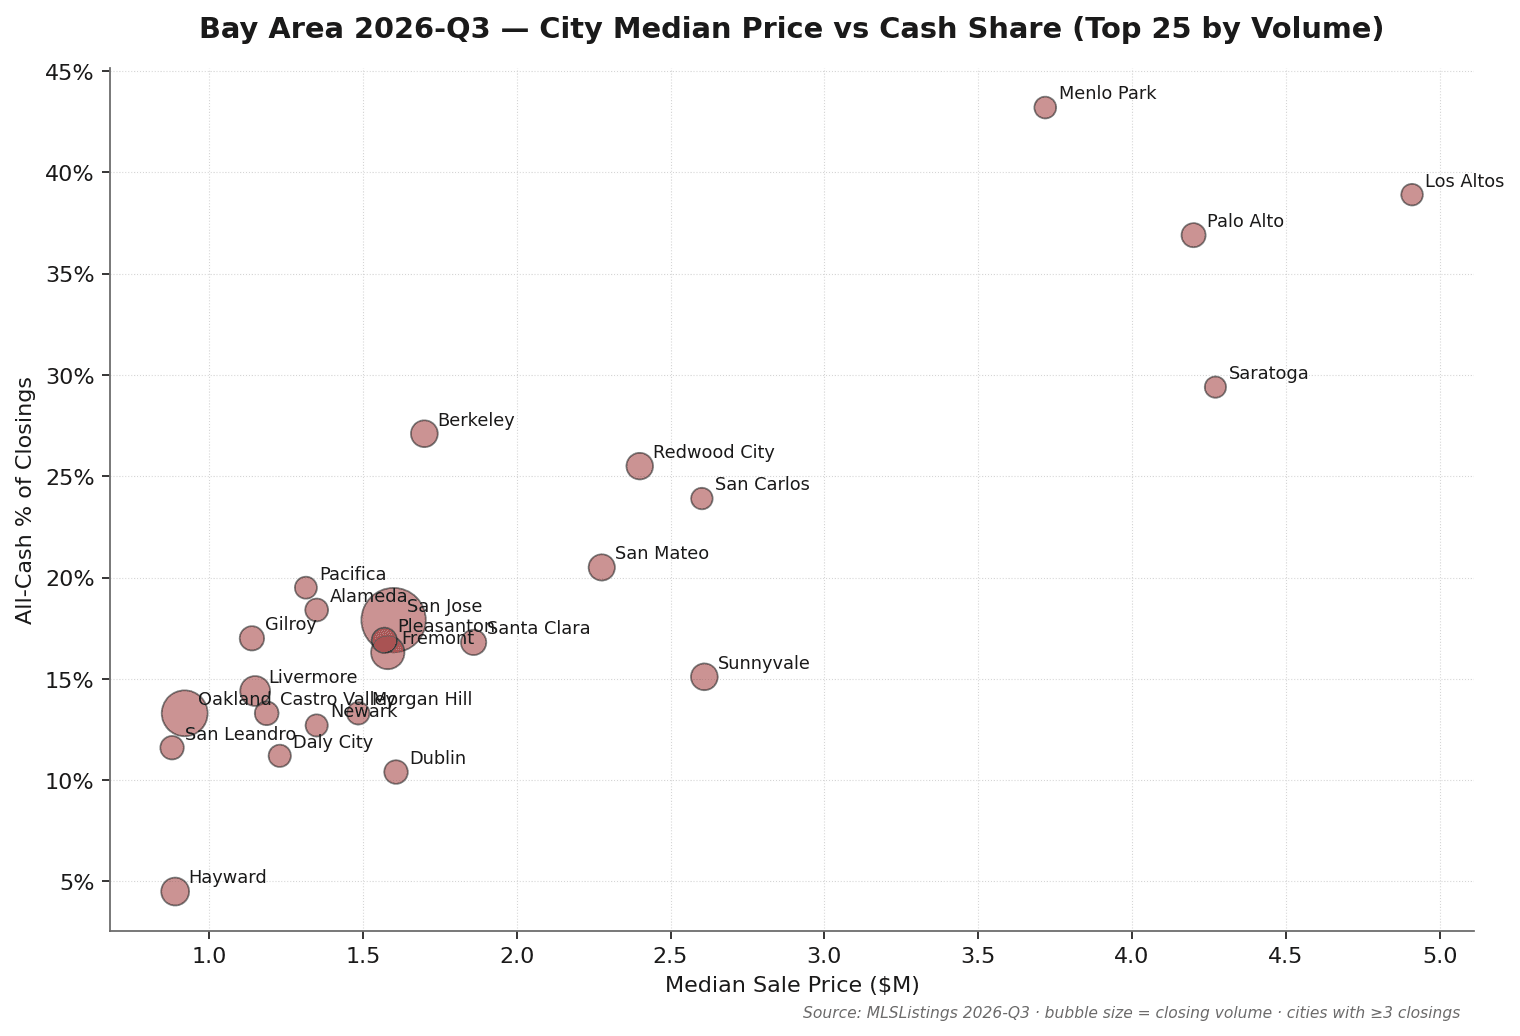
Tier 1 · Ultra-Luxury Anchor (Atherton / Hillsborough / Woodside / Los Altos Hills)
Median sale $4M+, cash share 43–62%, under 40 closings per city per quarter. This quarter's protagonist is Atherton: 21 closings at a $12.25M median (+58% YoY; $10.00M in Q2), 61.9% cash, 9-day median DOM, sale-to-original 105.4% — the city as a whole closed above list, its strongest reading in the seven quarters of this series (previous high: 102.8% in Q1 2026). Eight Atherton closings in the $10M–$20M band sold 7–41% over original list. Hillsborough: 33 closings, $6.60M median (+29% YoY), 51.5% cash. Los Altos Hills: 28 closings, $6.63M, 98.0%. Woodside: 23 closings, $4.08M, 47.8% cash (74.2% in Q2), 32-day DOM. MLS still understates this tier's true activity given its off-market share.
Tier 2 · Premium School-District Core (Palo Alto / Los Altos / Cupertino / Menlo Park / Saratoga)
Median $3.0M–$4.9M, cash share 15–43%, tight seller's market. Palo Alto Q3: 103 closings, $4.20M median (+2.4% YoY), sale-to-original 107.6% — a third straight quarter at or above 105%, and the highest of the three. Los Altos: 72 closings at $4.91M (+14% YoY), 104.8%. Menlo Park: 74 closings at $3.72M (+20% YoY), 43.2% cash — the tier's highest — and 104.3%. The exceptions are Saratoga (68 closings, $4.27M, 17-day DOM, 100.0%) and Cupertino (59 closings, $3.02M, 101.1%), both back near list. Palo Alto, Los Altos and Menlo Park carry the $3M–$5M band's 105.6%.
Tier 3 · Tech Corridor Core (Sunnyvale / Mountain View / Santa Clara)
Median $1.9M–$2.9M, dense AI/FAANG buyer base. Mountain View Q3: 63 closings, $2.93M median (+15% YoY), sale-to-original 106.2% — the fiercest bidding of the three this quarter. Sunnyvale: 139 closings, $2.61M, 104.9% (107.1% in Q2). Santa Clara: 119 closings, $1.86M, 101.7%. Still the sweet spot for upper-mid tech buyers, but Sunnyvale's easing premium shows $2.5M mortgage buyers starting to feel 6.68%.
Tier 4 · Mainstream Housing Market (San Jose / Fremont / San Mateo / Redwood City)
The Bay Area's baseline — and the tier where this quarter's cooling is most visible. San Jose: 1,062 closings, 20.8% of regional volume, $1.60M median (−3.0% YoY), 17.9% cash, 14-day DOM, sale-to-original 100.0% (102.6% in Q2) — the baseline is back at list. Fremont: 246 closings, $1.58M ($1.80M in Q2), 100.4%. The Peninsula side still carries a premium: San Mateo 132 closings, $2.28M, 108.9%; Redwood City 137 closings, $2.40M (+13% YoY), 104.1%, 25.5% cash.
Tier 5 · East Bay Expansion (Oakland / Berkeley / Hayward / Pleasanton / Livermore / Piedmont)
The widest internal variation of any tier — and home of the list-low-invite-bidding culture: Berkeley's median sale-to-original hit 133.7% (region high), Piedmont 131.8%, Albany 128.7%, Oakland 110.9%. Read those ratios carefully: they reflect deliberate underpricing strategy, not Peninsula-style premiums. Oakland: 513 closings (regional No. 2) at $921K (+7% YoY); Hayward 156 at $890K with 4.5% cash, the lowest among the top 25 cities. The tier's most telling number is Pleasanton: 118 closings, $1.57M, DOM stretched from 10 days in Q2 to 26, sale-to-original 96.7% — the clearest rate-sensitivity signal among the region's larger cities. Livermore: 187 closings, $1.15M, 100.0%. The East Bay still behaves like several distinct markets.
Tier 6 · Coastal / Outer Suburbs (Pacifica / Half Moon Bay / Gilroy / Morgan Hill)
Median $1.1M–$1.7M, DOM 16–42 days (Half Moon Bay 42, Gilroy 23, Morgan Hill up from 9 days in Q2 to 18), sale-to-original 94–103%. Mortgage buyers dominate (Half Moon Bay's 44.8% cash is the second-home exception), making this the most rate-sensitive tier — Q3's 26 bps rate increase registered most clearly in this group's DOM, and Half Moon Bay's median sale fell to 94.0% of original list.
City data (21 representative cities)
| City | Closings | Median sale | Cash % | DOM | Sale/orig % |
|---|---|---|---|---|---|
| San Jose | 1062 | $1.60M | 17.9% | 14 | 100.0% |
| Oakland | 513 | $921K | 13.3% | 15 | 110.9% |
| Fremont | 246 | $1.58M | 16.3% | 12 | 100.4% |
| Livermore | 187 | $1.15M | 14.4% | 13 | 100.0% |
| Hayward | 156 | $890K | 4.5% | 15 | 100.9% |
| Berkeley | 140 | $1.70M | 27.1% | 14 | 133.7% |
| Sunnyvale | 139 | $2.61M | 15.1% | 8 | 104.9% |
| Redwood City | 137 | $2.40M | 25.5% | 12 | 104.1% |
| San Mateo | 132 | $2.28M | 20.5% | 9 | 108.9% |
| Santa Clara | 119 | $1.86M | 16.8% | 11 | 101.7% |
| Pleasanton | 118 | $1.57M | 16.9% | 26 | 96.7% |
| Gilroy | 106 | $1.14M | 17.0% | 23 | 99.2% |
| Palo Alto | 103 | $4.20M | 36.9% | 9 | 107.6% |
| Menlo Park | 74 | $3.72M | 43.2% | 9 | 104.3% |
| Los Altos | 72 | $4.91M | 38.9% | 8 | 104.8% |
| San Carlos | 71 | $2.60M | 23.9% | 8 | 105.0% |
| Saratoga | 68 | $4.27M | 29.4% | 17 | 100.0% |
| Los Gatos | 65 | $2.90M | 20.0% | 22 | 100.0% |
| Mountain View | 63 | $2.93M | 19.0% | 8 | 106.2% |
| Cupertino | 59 | $3.02M | 15.3% | 11 | 101.1% |
| Burlingame | 57 | $3.45M | 19.3% | 9 | 107.9% |
Source: MLSListings Q3 2026 · cities with 3+ in-quarter closings (57 cities ranked)
8. Takeaways for Sellers, Buyers, and Cross-Border Investors
For sellers
- Below $3M, the premium window has closed — list at market and stop expecting a bump. Market-wide median sale-to-list is 101.4%, the three bands below $3M run 100.2–101.6%, DOM 13–16 days; San Jose, Fremont, Cupertino and Saratoga are all back at list. Spring's list-low-and-bait strategy no longer works at these rates — a home priced 2–3% above market will simply sit.
- $3M–$5M can still list at market and let competition add 5–6%, but don't mistake it for a general rule. This is the only band under $10M still bidding up, carried by school-zone demand and high-down-payment buyers; a $2M home in the same city is closing at list. Eight to ten weeks of pre-listing preparation still pays, but confirming that your home actually sits inside this band's buyer profile pays more.
- Above $10M, Atherton is in a bidding war and the $20M+ slow lane is discounting deeply — precise pricing has never been worth more. Atherton city-wide closed at 105.4% in 9 days; but the six overpriced $20M+ homes averaged 85 days and surrendered 5–20%, the dearest of them $18M. Where comparables don't exist, pricing on conviction costs tens of millions.
For buyers
- Below $3M, this is the first window in three quarters to buy at list. Median sale-to-original in the three sub-$3M bands moved from 100.5–105.8% in Q1 and 101.3–103.8% in Q2 to 100.2–101.6% in Q3 — the spring over-bidding has receded to Q3 2025 levels. The price is a 6.68% rate; but if your down payment is large and your payment sensitivity low, Q3 is the least competitive entry point of 2026 so far.
- In $3M–$5M, keep the 5–10% over-list expectation. Three straight quarters as the most competitive band; Palo Alto 107.6%, Burlingame 107.9%, Mountain View 106.2%. Structural advantages — cash ratio, down payment size, fast close — still beat incremental over-bidding, and the band's cash share of 25.3% is 3.5 pp higher than a year ago: your competition is getting stronger too.
- Above $10M, it's a two-speed market with two opposite decision windows. Correctly-priced homes are gone in 0–7 days (three $20M+ fast-lane closings this quarter, eight Atherton closings over list) — no negotiating room, only decision speed. Mispriced homes sit 30–154 days and negotiate 5–20%. Decide which one you're facing before you engage, then use entirely different playbooks.
For cross-border investors
- The all-cash advantage in $5M–$10M strengthened versus Q2. Cash share there is 46.0% (+1.6 pp QoQ, +2.3 pp YoY), yet 54% of local buyers are borrowing — at a 6.68% cost of funds. Every step up in rates strengthens the relative bargaining position of a cash offer. Cash plus fast close plus clean contingencies worked better in Q3 than in Q2.
- Finalize trust / LLC ownership structure before any offer. FIRPTA withholding (15% for foreign sellers), estate tax exposure, and FinCEN BOI reporting are all expensive to restructure after the fact. Cross-border capital paths (compliant FX purchase + offshore intermediary bank + U.S. escrow) are mature; the binding constraint is almost always structure decided too late.
- The $20M+ slow lane is the most interesting corner of the market for cross-border cash buyers this quarter. Six slow-lane homes averaged 85 days on market and closed at 79.5–95.1% of original list, and seven of nine $20M+ closings were all-cash — sellers at this level price certainty highly, and a contingency-free cash offer that can close within 30 days is itself a bargaining chip.
⚠️ Tax and legal content in this section is for general informational purposes only and does not constitute professional advice. Consult a qualified tax attorney or CPA for your specific situation.
9. Methodology & Definitions
Data source
Core data sourced from MLSListings (the primary Bay Area MLS, covering Santa Clara, San Mateo, Santa Cruz, and Monterey counties, with regional agreements extending coverage to Alameda, Contra Costa, San Francisco, Marin, and Solano). Macro indicators from FRED (Freddie Mac PMMS, U.S. Treasury, BLS, S&P Global, S&P CoreLogic).
Extraction basis
Since July 2026, this series pulls MLSListings data with the quarter range set on close-of-escrow date (COE Date) rather than contract date (Sale Date); this is the second issue on that basis, and the Q3 2025 baseline used for YoY comparison was rebuilt on the same basis. This quarter's data was extracted on October 10, 2026 (ten days after quarter end); late-reported September closings may not yet have been in the database. September's share of the quarter (33.8%) matches a year earlier (33.5%), with no visible shortfall.
Time window
- Q3 in-quarter data: CloseDate [2026-07-01, 2026-09-30], 5,098 records (July 1,786 / August 1,591 / September 1,721)
- In-quarter data only — no QTD supplement and no forward projections.
Property type
Single Family Residential (SFR) only. Condos, multi-family, and land excluded.
All-cash definition
MLSListings "Buyer Financing" field value of "All Cash No Loans" or "Cash to Existing Loan" classified as cash. All other values (Conventional, FHA, VA, Private, etc.) classified as financed. Field completeness: 98.9% in this dataset, with definitions identical to the previous two issues and the archived 2025 baselines.
Price band classification
Based on Sale Price (actual close price), not List Price. All medians are statistical medians, not means.
Exclusions
- Status = Cancelled / Expired / Withdrawn: excluded
- Sale Price < $100,000: excluded (likely family/trust/divorce transfers or data-entry errors; 1 record this quarter)
- Records with a missing Sale Price: excluded (0 records this quarter)
Verification
The cash-classification benchmark established in the Q1 2026 issue carries forward: that issue sampled 20 transactions in the $5M+ segment against publicly-recorded Santa Clara and San Mateo County Deed of Trust filings, with the MLSListings Buyer Financing field matching 95% of the time (19 of 20). This issue uses the same field and criteria.
Known limitations
- Off-market transactions not on MLS are excluded. Industry estimates suggest $5M+ off-market volume adds 15–25% on top of public MLS counts. The 9-transaction $20M+ figure reflects only public closings.
- The $20M+ and $10M–$20M samples are small (n=9 / n=36); single-quarter ratios are volatile, and trend judgments should rest on consecutive quarters.
- About 1.4% of records (71) lack an original list price and are omitted from sale-to-original-list ratios.
- School-zone-level segmentation remains under data validation and is not in this issue; it will be added as a standalone section once validated.
10. About MK Group
MK Group (Meridian Keystone Real Estate Group) is a Bay Area real estate team based in Cupertino, co-founded by Marie Wang (DRE# 02110980) and Kevin Mo (DRE# 02127623), operating with Keller Williams Realty.
The team focuses on the $3M–$30M+ buy and sell market across the SF Peninsula and South Bay, with deep specialization in cross-border buyer advisory. MK Group is one of the few Bay Area teams with both deep English-language market fluency and native Chinese-language service capability — 68K+ combined YouTube subscribers (@MarieWang 44K+ / @KevinMoRE 24K+), plus Xiaohongshu and WeChat reach.
About the MK Bay Area Pulse Series
Pulse is a quarterly market intelligence report grounded in complete MLS closing data, FRED macro indicators, and direct transaction observations from 200+ client engagements. It is designed to serve buyers, sellers, investors, media, and researchers who need data-driven, source-transparent, cross-tier Bay Area market analysis.
Citation
Please cite as: "MK Bay Area Pulse 2026-Q3, MK Group"
For high-resolution charts, full dataset, or press inquiries, contact Marie Wang(marie@mkbayarea.com) or Kevin Mo(kevin@mkbayarea.com), write to team@mkbayarea.com, or use the form at mkbayarea.com/contact
Next issue
Q4 2026 Pulse is expected in late January 2027 — the first issue with a complete four-quarter 2026 series, enabling full-year 2025 vs 2026 comparison band by band.
Questions about your specific situation?
Data provides context — your decision depends on your timeline, budget, and goals. Reach out to Marie Wang or Kevin Mo directly. First consultation is always free and carries no obligation.