Direct Answer
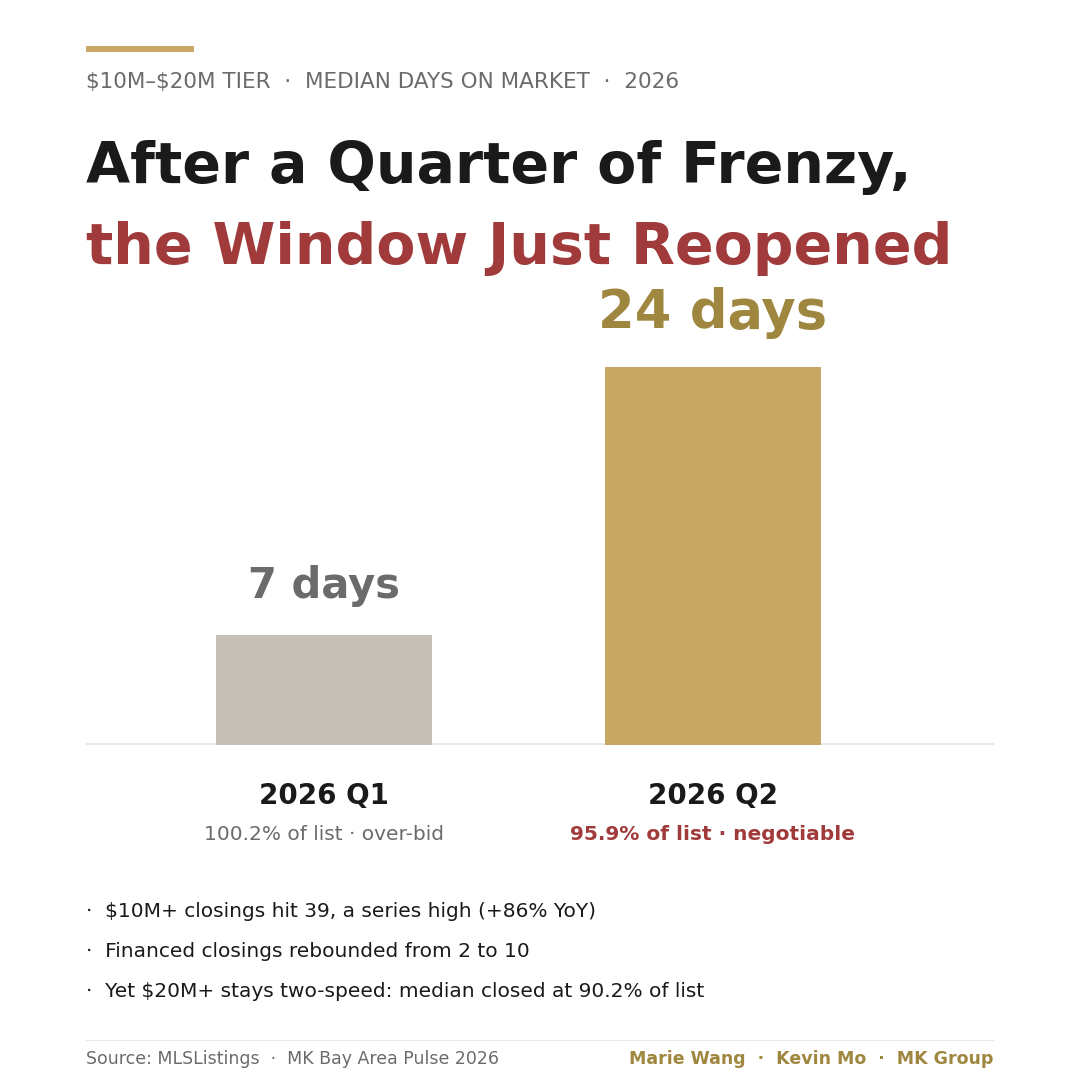
Mostly no — core-area $10M+ stayed supply-short and competitive. In Q2, Bay Area $10M+ closings hit a series-high 39 (+86% YoY): a quarter of strong demand, not a softening market. You may have seen the claim that "a negotiating window reopened in Q2." That misreads the data: the $10M–$20M tier's median days on market moved from Q1's 7 to Q2's 24, but Q1's figure rests on a mere 15 closings — 7 days is noise, 24 days is still historically fast at $10M+, a reversion from a fluke quarter to normal rather than a window opening. Only one kind of home is really negotiable: one anchored well above the market and sitting 30+ days. What decides negotiability is how far a home's original price sits from the market — not the tier, and not "timing."
This article is for decision-making education and does not constitute investment, bidding, or financing advice; confirm the specifics with your agent, attorney, and lender.
Who This Article Is For
- Buyers with $10M+ shopping Atherton, Palo Alto, Los Altos Hills, or Woodside, trying to read whether now is the time to move and whether there is room to negotiate.
- Buyers who stepped back in late-2025 because they kept getting out-bid, wanting to know whether Q2 actually softened and is worth re-entering.
- Sellers preparing to list a $10M+ home and weighing how high to set original list — and how that starting number will govern both speed and final price.
- Cross-border and pre-IPO buyers sizing a cash-versus-leverage mix at this tier for the first time, who want to understand what the return of financing means.
One: What Actually Changed in Q2 — Two Real Structural Shifts, and One Misread Signal
Be precise: Q2 had two real structural shifts — supply and the return of leverage — and one widely misread signal, the $10M–$20M tier's days on market. Keep them apart and you avoid the "negotiating window reopened" misjudgment.
Real shift 1: Supply hit a series-high 39 — demand being met, not demand weakening
Q2 saw 39 $10M+ closings across the Bay Area, a high for our quarterly series (+86% versus 21 in Q2 2025). Note what a closing is: a completed buyer-seller deal. A record count signals strong demand and active transacting, not homes going unsold. Core areas stayed supply-short this quarter — the surge in volume is evidence of competitiveness, not softening.
Real shift 2: Financed deals back from 2 to 10 — leverage returned, depth restored
Financed $10M+ deals rose from 2 in Q1 to 10 in Q2: the "all-cash or out" squeeze eased and leveraged buyers re-entered, restoring depth. The practical meaning for buyers — a financed offer no longer washes out automatically (see "Cash vs leverage" below). Why leverage returned — the stock-market and rate math behind it — is unpacked in the Q2 return of luxury leverage.
The misread signal: days on market 7 to 24 is a small-sample reversion to normal
This is where the story gets told as "the window reopened," and it does not hold up. First, Q1's 7-day median rests on the $10M–$20M tier having only 15 closings all quarter — 7 days in 15 samples is essentially a fluke, not a stable baseline. Second, 24 days is historically normal-to-fast at the $10M+ tier; it is no "slowdown." Third, sale-to-list is the same: Q1's 100.2% (closing over list) looks like a bidding market, but Q4 2025 was already 99.7% (below asking) — meaning Q1's 100.2% was the anomaly, and Q2's 95.9% is a reversion from anomaly to normal, not a new negotiating window. Misreading "back to normal" as "a market turn" is the biggest trap in this data set.
Two: Where Room Actually Exists — the Two-Speed Market Above $20M
Asking "is $10M+ negotiable" by tier asks the wrong question — negotiability is a deal-by-deal pricing question. $20M+ shows it best: a two-speed market where market-priced homes still get grabbed — even over asking — while only over-anchored ones drift down to a discount. The difference is not how grand the home is; it is whether original list was set near the market. This section is where the article actually answers which homes are negotiable.
The core numbers: in Q2 2026 the Bay Area recorded six $20M+ public closings, a 44-day median at 90.2% of original list (a roughly 9.8% median discount). But laid out one by one, they run from 80.4% (well below asking) all the way to +17.8% over asking.
| Home (Q2 2026 · $20M+ closing) | Original list | Sold | Sale/list | DOM | Payment |
|---|---|---|---|---|---|
| Atherton · 77 Flood Cir | $34.5M | $27.75M | 80.4% | 70 | Cash |
| Palo Alto · 444 Tennyson | $24.89M | $22.0M | 88.4% | 97 | Financed |
| Atherton · 167 Almendral | $24.5M | $21.9M | 89.4% | 98 | Cash |
| Atherton · 241 Polhemus | $25.0M | $22.75M | 91.0% | 8 | Cash |
| Atherton · 98 Flood Cir | $20.0M | $22.0M | 110.0% | 18 | Cash |
| Atherton · 60 Ralston | $18.0M | $21.2M | 117.8% | 4 | Cash |
The pattern to hold onto: this table is essentially sorted by whether original list was set right. The two over-asking closings (98 Flood Cir at $20M, 60 Ralston at $18M) had the most restrained starting prices — priced to the market, they drew competition and cleared over list in 4 to 18 days. The two deepest discounts (77 Flood Cir at $34.5M closing 80.4%, 444 Tennyson at $24.89M closing 88.4%) carried the highest original asks — anchored high, they sat 70 to 98 days and found the market only after a 9%–20% discount. So what matters is how far a home's original price sits from the market, not which tier it is in. That the list price at the top is often just the seller's aspiration — negotiable year-round — is a separate, evergreen mechanism, unpacked in do $20M+ homes really sell below asking. The takeaway: even in this supply-short, competitive core market, a few badly mispriced homes are still negotiable — but that is an opportunity created by mispricing, not a window handed out by a softening market.
Three: The Buyer's Playbook — Two Different Offers for "30+ Days" vs "Freshly Listed"
Core areas staying competitive does not mean no home is negotiable — but the negotiable ones are only the type described above. The tier's 95.9% is a highly dispersed median: deal by deal, some closed well below list and others above, and days on market split too — half sat past 24 days, half moved faster. Read which half a home is in before you set your posture, and never treat a median as a permission slip to negotiate the whole tier.
On over-anchored homes sitting 30+ days: this is where the room is
When a $10M+ home's current days on market clearly exceed the tier median (24) and its original list was set high, the seller's anchor is being tested — this is where you open below asking and negotiate in rounds. Pull the full listing history first: original list, any price cuts, how many, how long on market. The higher the anchor and the longer the sit, the firmer your footing. In the table above, 77 Flood Cir — 70 days, closing at 80.4% — is the extreme of this type.
On freshly listed, market-priced homes: speed is still your friend
Run the other way: a home just listed at a restrained, market price will most likely still move fast — "the market loosened" does not help you here. 60 Ralston listed at $18M and closed in 4 days at +17.8%; 98 Flood Cir listed at $20M and closed in 18 days at +10.0% — priced-right homes still run over asking in this supply-short market. Carrying a blanket "the market softened, I can take my time" onto a sharply priced new listing is the easiest mistake to make.
Cash vs leverage: a financed offer is no longer the Q1 liability
A structural Q2 shift is the return of leverage — $10M+ financed closings went from 2 to 10. The mechanism: the market rose about 20.9% over the past year, so selling stock to raise all cash means exiting a still-compounding position and taking an immediate capital-gains hit, while mortgage or securities-based credit near 6.4% often costs less than these buyers' expected portfolio return. Using leverage here is opportunistic, not a dependency — a financed offer no longer washes out the way it did in Q1's scramble. But do not read that as "terms can loosen": in bilateral negotiation, clean, high-certainty terms (all cash, or pre-approved with a fast close) remain leverage. The full cash-and-pre-IPO funding path is in turning pre-IPO stock into a Bay Area luxury home.
Four: Why Q2 Is Not a "Market Turn" — a Fluke Quarter Reverting
This has to be said plainly, so it is not misread as "the turn is in, sit and wait for softer." What looks like a "change" from Q1 to Q2 is mostly statistical reversion, not a shift in fundamentals:
- Q1 was the anomaly, not the baseline. The $10M–$20M tier had only 15 closings in Q1; its 7-day median and 100.2% sale-to-list are that sample's fluke — and Q4 2025's median close was already 99.7% (below asking). Using a fluke quarter as the benchmark and then calling Q2 "softer" is mistaking noise for signal.
- Core supply-demand fundamentals did not change. Q2's $10M+ closings hit a series-high 39, +86% YoY — strong demand, active transacting; the added supply was absorbed by demand growing alongside it, and core areas stayed supply-short. That matches what agents see on the ground: good homes still go in days.
- The macro backdrop still leans tight. The S&P at record highs (+20.9% YoY) keeps minting $10M+ buyers, the Case-Shiller San Francisco index turned positive year over year (+2.47%), and while the 30-year mortgage is down 37bps YoY it is up 31bps QoQ. On balance these forces support demand, not suppress it.
So whether to move turns on your own timeline, the scarcity of the home, and that specific home's pricing — not on a bet that next quarter softens further, which it most likely will not. The next MK Bay Area Pulse will keep testing this with fresh data, but do not treat one small-sample quarter as a trend.
Local Data: $10M–$20M and $20M+ Across Three Quarters
The headline first — but do not read it as a "negotiating-strength arc": the $10M–$20M tier's Q1 2026 column (a 7-day median at 100.2% of original list) is a 15-deal small-sample anomaly; Q2's 24 days at 95.9% (below asking) is the reversion to normal. The $20M+ tier is a small, volatile sample across all three quarters: 80 days / 82.4% in Q2 2025, briefly at 9 days / ~100% in Q1 2026, then 44 days / 90.2% in Q2 — that back-and-forth is exactly why you should not tell a trend story from six closings.
| Tier | Quarter | Closings | Median DOM | Median sale/original |
|---|---|---|---|---|
| $10M–$20M | 2025 Q2 | 18* | —** | —** |
| $10M–$20M | 2026 Q1 | 15 | 7 | 100.2% |
| $10M–$20M | 2026 Q2 | 33 | 24 | 95.9% |
| $20M+ | 2025 Q2 | 3 | 80 | 82.4% |
| $20M+ | 2026 Q1 | 6 | 9 | ~100% |
| $20M+ | 2026 Q2 | 6 | 44 | 90.2% |
* Combined $10M+ was 21 closings in Q2 2025 (of which 3 were $20M+) and 39 in Q2 2026 — up 86% and a series high. ** Small sample that quarter; median DOM and sale-to-list not broken out for this sub-tier.
What to hold onto: the $10M–$20M Q1 column (7 days, 100.2%) is a 15-deal anomaly, not a baseline; Q2 (24 days, 95.9%) is the reversion to normal, not a "reopened window." The $20M+ tier is the further caution against over-reading: it ran 9 days in Q1 and 44 in Q2 — a small, volatile sample whose median must be read alongside the deal-by-deal table above, or its six-closing median will mislead. The real message of the table is "pricing decides each home's fate," not "the tier is softening overall."
Data sources: MLSListings public closing records / MK Bay Area Pulse 2026 Q2 / H1 2026
Last updated: 2026-07
Scope: Bay Area (Peninsula / South Bay; Santa Clara / San Mateo / Alameda counties) single-family closings above $10M; the $10M–$20M and $20M+ tiers are small samples, flagged deal by deal.
The MK Group Field Observation: Negotiation Comes From Reading the Seller, Not Waiting for a "Market Window"
In a supply-short market where core areas stay competitive, the buyers who bring a price down are not the ones who got lucky with a window — they are the ones who read the seller's situation and dared to act on the right home. MK Group's two founders, Marie Wang (DRE# 02110980) and Kevin Mo (DRE# 02127623), handled a late-2025 deal that shows exactly this.
In late 2025, a family working at a leading AI company came to MK Group: they had liquidated pre-IPO company stock in tranches on the secondary market and were buying a Los Altos Hills estate all-cash, the goal being to lock a home before the company's IPO sent a wave of newly wealthy colleagues sweeping the top of the market. Many would assume that an all-cash buyer under time pressure to close before an IPO is a "whatever the seller asks" buyer. Instead, once MK took over the negotiation, drawing on a long read of luxury supply and demand and a feel for the seller's psychological timing, they brought the price down by more than $1M from original. That is what luxury negotiation actually looks like: even as a cash buyer, even under a clock, when you read a home's pricing and the seller's motivation, $1M+ of room is real and reachable.
The real lesson is not "wait for the market to open a window." It is that room comes from the specific home and the specific seller, not from a broad "market timing." The same Los Altos Hills home is negotiable or not depending on how far its original price sits from the market, why the owner is selling, and whether you read those two things — not on which quarter you happen to be in. So the question more useful than "are luxury homes negotiable" is: is this home priced right, and what is the seller's situation? Read original pricing, days on market, and seller motivation together, and you will know whether to enter with speed or with patience.
(The case above is anonymized: the client is described only as "a family working at a leading AI company," with no name, title, share count, or absolute closing price; the $1M+ of negotiating room comes from a real transaction in MK Group's own record. Tier-level closing figures are from MLSListings public closings / MK Bay Area Pulse 2026 Q2.)
Common Mistakes
Mistake 1: "Q2 slowed down — the market softened, $10M+ is negotiable across the board now"
Wrong, and it is the easiest trap in this data. The $10M–$20M tier's days on market went from 7 to 24, which looks like "slowing," but Q1's 7 rests on only 15 closings all quarter — a small-sample fluke — and 24 days is historically normal-to-fast at $10M+. Meanwhile $10M+ closings hit a series-high 39 (+86% YoY), which is exactly what a supply-short core market looks like. Mistake "reversion to normal" for "the market softened," bring that to the table as blanket lowballing, and you will most likely neither move the home nor win it (source: MK Bay Area Pulse 2026 Q2).
Mistake 2: "If some homes are negotiable, every $10M+ home is negotiable"
Wrong. Negotiability is a deal-by-deal pricing question, not a tier. $20M+ is the classic two-speed market: 60 Ralston listed at $18M and closed in 4 days at +17.8%, while 77 Flood Cir listed at $34.5M closed 70 days later at just 80.4%. Whether a home is negotiable turns on how far its original list sits from the market, not which tier it is in. Bring a "the market softened" mindset to a sharply priced new listing and you will neither move it nor win it (source: MLSListings Q2 2026 closings).
Mistake 3: "30+ days on market means something's wrong — negotiate freely"
Read it with the original price; do not treat days on market alone as a discount guarantee. Long sits come in two kinds: original list set high and the anchor slowly disproven by the market (real room here), or a seller in no hurry, content to wait for the right buyer (you will not move them). The 70-to-98-day homes in the $20M+ table are mostly the former, but sellers who sit for months and give nothing exist too. Treating DOM as sufficient grounds to negotiate is an easy misread (source: MK Bay Area Pulse 2026 Q2).
Mistake 4: "$10M+ requires all cash — a financed offer is out"
That was Q1's scramble; it no longer holds in Q2. $10M+ financed closings rose from 2 to 10 — the return of leverage means a financed offer is no longer an automatic liability. The reason: with the market up 20.9% over a year, raising all cash means exiting a compounding position and taking a capital-gains hit, while credit near 6.4% often costs less than expected portfolio returns, making leverage an opportunistic choice. But do not read it as "terms can loosen": in bilateral negotiation, clean, high-certainty terms (all cash, or pre-approved with a fast close) are still leverage (source: MK Bay Area Pulse 2026 Q2).
Next Steps
- Pull "original list → current list → days on market" as a set — a high original price plus 30+ days on market is the real signal of room, not a blanket "luxury is always negotiable."
- Keep your speed on freshly listed, market-priced homes — in Q2 restrained pricing still cleared over asking in 4–18 days; do not misread "the market loosened" as "everything can be negotiated slowly."
- Settle your funding structure early — Q2's return of leverage means a financed offer is no longer out, but clean, certain terms remain leverage at the table. The cross-border cash and pre-IPO path is in turning pre-IPO stock into a Bay Area luxury home.
- Do not treat one quarter as a trend — Q2's 24 days / 95.9% is a reversion to normal from Q1's 15-deal small-sample quarter, not a market turn; the next MK Bay Area Pulse will keep testing it. Cross-check the Bay Area off-market channel guide to gauge how many closings never touch public MLS.
- Assume core areas are a supply-short, competitive market by default; pull "original list → current list → days on market" on the specific home to judge whether it is the over-anchored, negotiable exception — the top-tier mechanism of "list price as aspiration, negotiable year-round" is in do $20M+ homes sell below asking.
⚠️ This article is for decision-making education and does not constitute investment, bidding, tax, or financing advice; confirm the transaction structure and funding arrangements with your agent, attorney, CPA, and lender.