Direct Answer
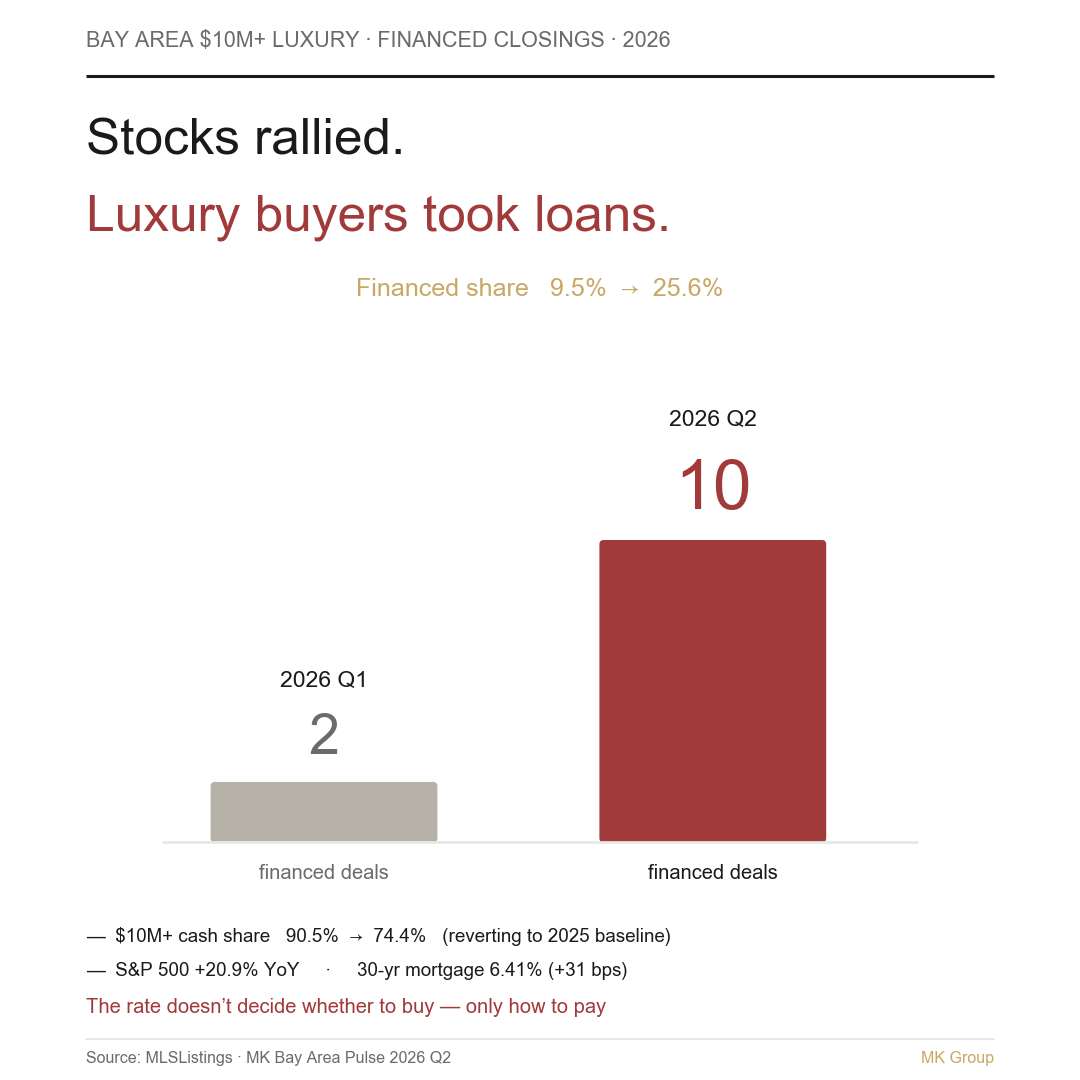
Because a soaring market made selling stock to pay cash expensive. In Q2 2026, Bay Area $10M+ closings numbered 39 (up 86% YoY), and financed deals jumped from 2 in Q1 to 10—while cash share eased from 90.5% to 74.4%. It is not that buyers ran short of cash. The same high-net-worth cohort is simply running a sharper math: the rate does not decide whether they buy, only how they pay.
This article touches on capital-gains tax, securities-backed credit, and financing decisions. It is for decision-making education and does not constitute legal, tax, or investment advice; confirm the specifics with your CPA, wealth advisor, or mortgage advisor.
Who This Article Is For
- Buyers at $5M+ weighing all-cash against leverage—especially anyone holding a large block of appreciated stock and torn about whether to sell.
- High-net-worth families whose portfolio return runs well above the mortgage rate, who want to treat "cash vs. borrow" as a cost-of-capital problem, not a status choice.
- Cross-border wealth advisors, family-office CIOs, and mortgage or private-bank advisors who need a data-backed read on whether higher rates push luxury buyers out.
- Readers of our Q1 "credit decoupling" piece who want to see how that thesis holds up after a quarter of stress-testing.
Three Counterintuitive Signals in Q2
Run the classic rate-and-housing model and Q2’s three signals should point the same way. They fought each other instead.
One: rates rose, not fell
The 30-year fixed mortgage rate climbed to 6.41% in Q2, up 31 basis points from Q1 (Freddie Mac PMMS). By the textbook, dearer borrowing should suppress leverage.
Two: equities were up a fifth over the year
The S&P 500 rose 14.87% in the quarter and 20.86% over the year (FRED SP500). When the wealth effect is strongest, paying cash should feel easiest—paper wealth is ample, and a small sale covers the whole ticket.
Three: luxury didn’t retreat—it grew, and it started borrowing
The $10M+ band closed 39 deals in Q2, up 86% from 21 a year earlier; $20M+ doubled from 3 to 6. Alongside that volume, financed deals jumped from 2 in Q1 to 10, the financed share moved 9.5%→25.6%, and cash share slid from 90.5% to 74.4%. Rates up, equities up, luxury both expanding and levering—those three do not reconcile in the old model, so it needs a different frame.
The Mechanism: What Changed Is the Opportunity Cost of Selling Stock
The main variable in a $10M+ buyer’s equation was never the mortgage rate. It is the spread between the cost of borrowing and the cost of liquidating an appreciated position.
Take a concrete case. To bring $15M in cash to a purchase, a buyer sells a large long-held block—and that sale does two costly things. First, it exits a position that is still compounding: at roughly 20% a year (the S&P was up 20.86% over the period), the opportunity cost on $15M runs to the low millions annually. Second, it triggers a capital-gains bill now: on a low-basis, long-held holding, federal long-term capital-gains tax stacked with California taxing gains as ordinary income is a substantial one-time cost for a high-income household. Together, the true cost of "sell to pay cash" sits well above the price on the tag.
On the other side stands a mortgage near 6.4%, or a securities-backed line of credit (an SBLOC drawn against the portfolio). The logic follows: if expected portfolio return runs well above 6.4%, keeping the position and borrowing the purchase price is the better math—you spare the opportunity cost and the tax bill.
It also explains why all-cash was equally rational in 2025. Back then the opportunity cost of selling was lower, while the speed and certainty of a cash close (7–10 days vs. 30–35 for a loan) was the decisive edge in a bidding contest—so cash was the optimum. By Q2 2026 the same buyers face a different equation: equities up 20.9% over the year lifted the cost of selling sharply, while borrowing came back only to 6.41%—so the rational choice shifted from "all cash" to "hold the position and borrow."
Note the counterintuitive part: rates rose and leverage use rose. That is the tell that the driver was never the rate itself—it is the spread between borrowing cost and portfolio return plus tax friction.
An Honest Revision to the Q1 "Credit Decoupling" Thesis
In Bay Area $10M+ Luxury Homes: 87% All-Cash we argued the $10M+ band had decoupled from the mortgage credit cycle. Q2 stress-tested that claim, and the verdict splits in two.
The half that holds: rates do not constrain luxury volume. Q2 rates rose 31 bps, yet $10M+ volume was up 86% YoY. If the tier were rate-sensitive, a hike should shrink volume; it did the opposite. That half stands firmly.
The half that needs revising: "luxury doesn’t use credit" overstated it. Q2’s 10 financed deals show luxury buyers do use credit—just differently. The accurate wording: these buyers are not credit-constrained, they are credit-opportunistic. They do not need a loan to afford the home; they pick the cheaper path between selling stock and borrowing. Credit is a treasury tool for them, not a prerequisite for the purchase.
Put the halves together and the revised thesis is both sharper and more durable: the rate does not decide whether a luxury buyer buys, only how they pay. Cash is still the entry qualification—you must be able to pay all cash, or beat cash on terms—and whether you then use cash or leverage is a cost-of-capital decision made after you have qualified.
Three Periods, By Tier: Cash Share and Financed Count
The core figures first: the $10M+ cash share ran 76.2% in 2025 Q2, spiked to 90.5% in 2026 Q1, and settled back to 74.4% in Q2. Line the three up and it reads clearly—Q1’s 90.5% was a cash pulse within a 21-deal small sample, and Q2, with volume doubling to 39 deals, simply returned cash share to its 2025 structural norm, carrying financed deals from 2 back to 10. The same shape shows in $5M-$10M: cash 45.3% in 2025 Q2, briefly a majority (53.7%) in Q1 2026, then back to 46.6% in Q2, with financing again over half (53.4%).
| Price band | Period | Closings | All-cash share | Financed deals |
|---|---|---|---|---|
| $5M–$10M | 2025 Q2 | 170 | 45.3% | 93 |
| $5M–$10M | 2026 Q1 | 123 | 53.7% | 57 |
| $5M–$10M | 2026 Q2 | 223 | 46.6% | 119 |
| $10M–$20M | 2025 Q2 | 18 | 77.8% | 4 |
| $10M–$20M | 2026 Q1 | 15 | 86.7% | 2 |
| $10M–$20M | 2026 Q2 | 33 | 72.7% | 9 |
| $20M+ | 2025 Q2 | 4 | 75.0% | 1 |
| $20M+ | 2026 Q1 | 6 | 100% | 0 |
| $20M+ | 2026 Q2 | 6 | 83.3% | 1 |
| $10M+ combined | 2025 Q2 | 21 | 76.2% | 5 |
| $10M+ combined | 2026 Q1 | 21 | 90.5% | 2 |
| $10M+ combined | 2026 Q2 | 39 | 74.4% | 10 |
What to hold onto: the $10M-$20M cash share eased year over year from 77.8% to 72.7% (-5.1 pp)—the first YoY decline for this band in the quarterly series we track—not because demand softened, but because rising volume pulled in more marginal buyers using leverage. The $5M-$10M band is the real dividing line here: it is now stably financed-majority (119 financed deals in Q2, over half), and Q1’s cash majority was the outlier. Q1 was the pulse; Q2 is the reversion. Treat $20M+ as a small sample—with only single-digit closings, one financed deal swings the share hard.
Sources: MLSListings (San Mateo / Santa Clara / Alameda counties, SFR closings) / MK Bay Area Pulse 2026 Q2 / Freddie Mac PMMS / FRED (S&P 500, Case-Shiller SF).
Updated: 2026-07.
Scope: Cash vs. financed structure of Bay Area Peninsula / South Bay $5M+ luxury closings in Q2 2026 (with Q1 2026 and 2025 Q2 comparisons). The $10M-$20M and $20M+ bands are small samples; financed counts are derived from each band’s published cash share.
The MK Read from the Field
MK Group co-founders Marie Wang and Kevin Mo have watched this "cash-capable, yet chose to finance" logic play out at the very top of the Peninsula and South Bay.
In a May 2026 off-market Atherton deal, MK—acting as buyer’s agent—helped a cross-border buyer acquire an $18M-tier home an architect had built to his own live-in standard, dense with hidden systems. The buyer had full-cash capacity but chose to finance for personal reasons: a loan of roughly $10M, requiring two bank appraisals and a 30–35 day timeline. The competing offers on the same home were mostly all-cash buyers who could close in 7–10 days. MK’s offer was neither the highest nor the more certain structure—on paper, the weaker hand.
It won on two things. Fit: the seller, an architect, cared whether the buyer could genuinely read the home’s invisible engineering rather than talk only price and appreciation; the buyer cancelled a planned trip and booked the first flight out to see it in person, and that move alone made the seller re-weigh the buyer’s seriousness. And engineered certainty: a ~$10M loan is one most lenders struggle to underwrite, so MK lined up a lender able to carry that size and ran several backups in parallel, turning the financing disadvantage into something controllable.
The point for this article is not the number—it is that the deal is a living sample of the credit-opportunistic buyer: cash capacity is the entry bar (the buyer had it, and had to win against an all-cash field), while choosing a loan is a treasury decision made afterward. It also settles something many misjudge—at the very top, a large jumbo is executable, provided you engineer the certainty in advance.
(This case is anonymized; identity, exact address, and household details are obscured. Price, capital structure, timeline, and the "cross-border buyer / off-market / non-highest offer chosen" features come from MK Group’s public record of the same real transaction.)
Common Misconceptions
Misconception 1: "Cash share fell from 90.5% to 74.4%—are luxury buyers out of money, is the market cooling?"
The opposite. Over the same span $10M+ volume rose 86% YoY (21→39 deals)—the market expanded. And 74.4% is not low: this band was already 76.2% in 2025 Q2, and Q1’s 90.5% was the cash pulse within a 21-deal sample. Q2 returned cash share to the 2025 norm while volume doubled. The dip is "more volume plus marginal buyers using leverage," not "buyers running dry."
Misconception 2: "Rates rose, so luxury buyers should wait for cuts"
Q2 rates rose 31 bps and luxury leverage rose in step—proof the rate is not in this cohort’s main equation. For $10M+ buyers, entry timing is triggered by liquidity events (IPO unlocks, tender-offer windows, cross-border funds landing), not by a Fed pivot. Betting entry on a rate cut means carrying both the risk of prices climbing while you wait and the risk of your target home going off-market. The Q1 decoupling piece breaks down the capital pools in full.
Misconception 3: "Q1 said luxury doesn’t use credit, Q2 says it started borrowing—isn’t that a contradiction?"
Not a contradiction—an honest revision. The Q1 half that "rates don’t constrain volume" still holds (a hike met with +86% volume is the evidence); what needed fixing was the overstatement "luxury doesn’t use credit." Precisely: these buyers are not credit-constrained, they are credit-opportunistic—they pick the cheaper path between selling stock and borrowing. Credit is a treasury tool for them, not a prerequisite for the purchase.
Misconception 4: "All-cash always beats a loan; a financed offer has no shot at the top"
Not always. In MK’s $18M off-market Atherton deal, an offer carrying a ~$10M loan—and not the highest price—beat an all-cash field, on fit with the home plus financing certainty engineered in advance. Cash’s edge is speed and certainty, but when a seller cares more about whether buyer and home are on the same wavelength and the lending side can show a credible plan, cash is not the only decider. A large jumbo is executable at the top; the key is locking a lender who can carry it and holding backups ready.
Next Steps
- Confirm the real capital structure of your band first. Check the cash ladder in MK Bay Area Pulse 2026 Q2: $5M-$10M is now financed-majority (over half in Q2, 53.4%), so if you sit there, all-cash is your edge over a minority of rivals, not the band’s norm.
- Treat "cash vs. loan" as a cost-of-capital problem, not an identity question. If your expected portfolio return runs well above today’s ~6.4% borrowing cost and selling would trigger a large capital-gains bill, holding the position and using a mortgage or SBLOC may be the better math—but run the tax and cash flow with your CPA and wealth advisor first.
- Whichever payment method you land on, have the entry qualification ready: the ability to pay all cash or to beat an all-cash field on terms. A large jumbo at the top needs a lender who can carry that size, with backups in parallel, so you engineer the financing certainty in advance.
- Do not bet entry timing on a Fed pivot. For $10M+ buyers the real trigger is a liquidity event—an IPO unlock, a tender-offer window, cross-border funds landing. Where rates go shapes how you pay, not whether you buy.
- If your purchase cash comes from pre-IPO or restricted stock, work out the "paper wealth → usable buying power" path and the financing/holding structure first—see turning pre-IPO stock into a Bay Area luxury home: financing and holding structures. To understand pricing and negotiation behavior at the $20M+ top, see Bay Area $20M+ ultra-luxury: is closing below asking the norm?