Quick Answer
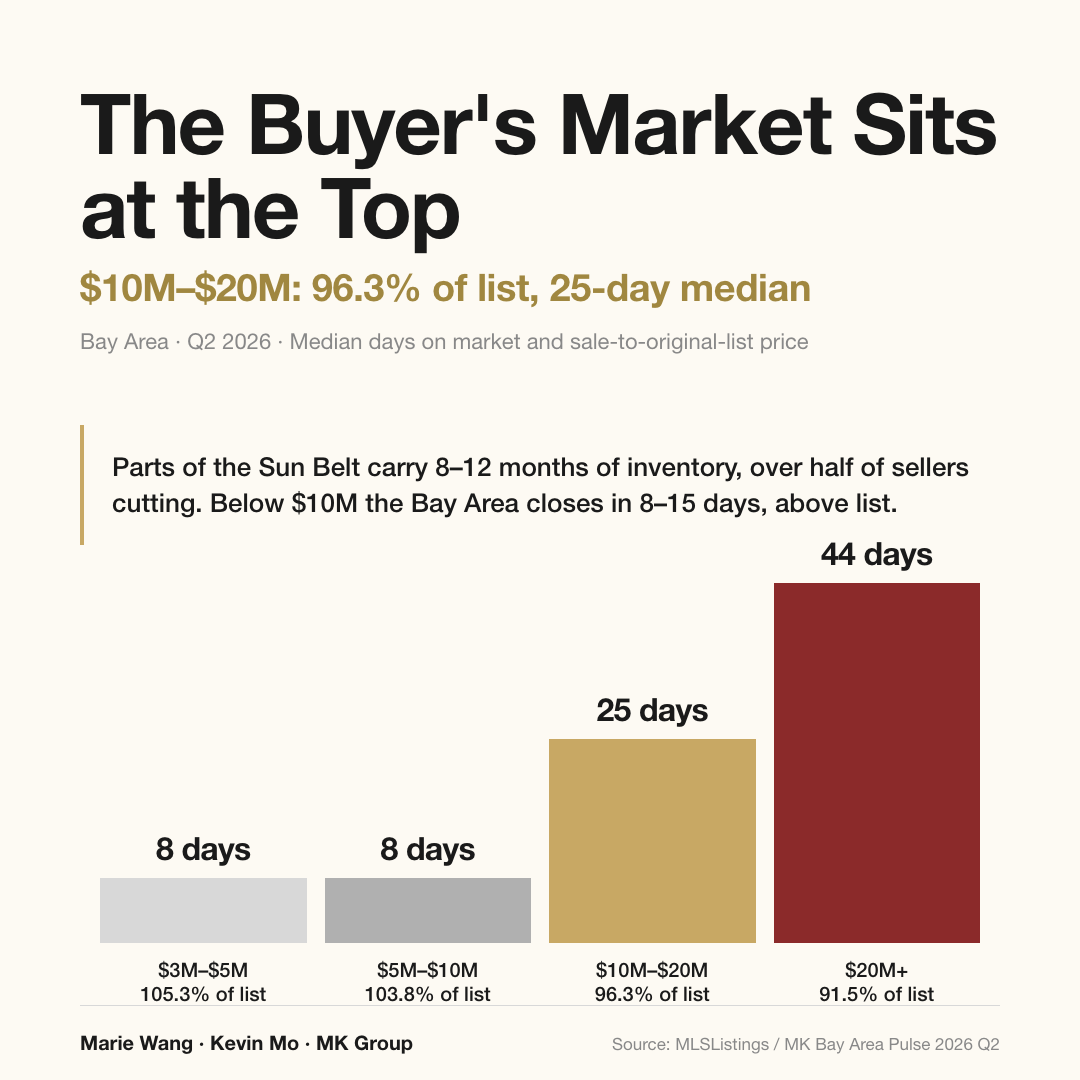
The national buyer's market is real, but the Bay Area sits on the other side of the split. In Q2 2026, every band below $10M still closed in 8 to 15 days at 101%–105% of original list. The only window that has actually opened here is above $10M, where the $10M–$20M band closed at 96.3% of original list.
Who this article is for
- Owner-occupier buyers who have read the "buyer's market is back" headlines and want to know whether that logic holds in the Bay Area
- Peninsula and South Bay families working a $3M–$5M budget and debating whether waiting another six months buys them a lower price
- Buyers above $10M who want to understand where the negotiating room in the luxury band actually comes from
- Bay Area owners wondering whether the national price correction will reach their own price band
- Long-horizon readers who want a clean method for separating national data from local data
Three dimensions that decide the answer
Dimension one: the national buyer's market is real, and inventory built it
Start by conceding the facts. On Realtor.com's basis, the U.S. median list price fell 2.5% year over year in June 2026 — the eighth consecutive month of year-over-year decline. Active listings in June were up 1.9% from a year earlier, though inventory still sits roughly 9.6% below the same period in 2019. Among homes that closed in February, 34.2% of sellers had cut their list price along the way, the highest February reading on record.
One number in that set is easy to read backwards. The share of active listings carrying a price cut in June came down to 18.8%, which is 1.9 percentage points below the same month last year. Fewer homes cutting price — is the market warming back up? No. Sellers changed strategy. Rather than list high and grind the price down, they are putting a realistic number on the board at launch. The eight-month run of year-over-year declines in the median list price is the result of that shift, not a contradiction of it.
Three forces built this. Owners who locked a rate just above 3% during the pandemic will not trade it for something above 6%, and that lock-in has been suppressing resale supply. Multifamily completions topped 600,000 units nationally in 2024, the most since 1986, and they landed disproportionately in the Sun Belt. Meanwhile population has been migrating toward the Midwest and Northeast. The units got built. The people went somewhere else.
The stress indicators moved in step. ATTOM counted 118,727 U.S. properties with foreclosure filings in the first quarter of 2026, up 6% from the prior quarter and 26% year over year, with May filings still running 14% above last year. The absolute level remains far below crisis-era readings and looks more like normalization after pandemic protections expired. On the rental side, ApartmentList put the June national median rent at $1,385, down 1.2% year over year, with San Antonio down 5% over twelve months — last among major metros — and the national rental vacancy rate touching 7.2%.
At the same time, another set of cities is climbing. Hartford, Connecticut; Rochester, New York; and Worcester, Massachusetts led with an average gain of 16.3%. Toledo, Ohio has seen its median list price rise 33.4% cumulatively since 2022, the strongest reading among Realtor.com's ten safe-haven markets. At the state level, New Jersey list prices are up about 5.9% and Illinois 4.8%, both propping up the national aggregate. So the accurate sentence is not that the country is falling. The country is splitting.
Dimension two: below $10M, the Bay Area is not on that curve at all
Put the local numbers next to the national ones and the arrow points the other way. MLSListings data shows the Bay Area's $3M–$5M band closing in a median 8 days in Q2 2026, at 105.3% of original list price. The $5M–$10M band also closed in 8 days, at 103.8%. Even the highest-volume band, $1.5M–$3M, took only 12 days and closed at 103.8%. Nothing loosens further down either: $1M–$1.5M ran 12 days at 103.2%, and under $1M ran 15 days at 101.3%. Not one of the five bands below $10M closed under original list.
Those figures barely parse in a Sun Belt context. In a genuine buyer's market the marketing period is measured in months, not days. Months of supply in Miami is near 12; Austin, Tampa, and Houston are approaching 8. A healthy market usually runs 5 to 6 months, and anything past 6 is conventionally a buyer's market. In those metros homes tend to close 3%–9% below list. Below $10M in the Bay Area, they close 1%–5% above original list.
The reason is not complicated. The national problem is too many houses and not enough people. The Bay Area has run the opposite imbalance for two decades: almost no large-scale new single-family supply, a lock-in effect made stronger still by Proposition 13's assessed-value freeze, and a demand base funded by technology equity that no national home-price index measures. For a Bay Area buyer under $10M, the honest conclusion is that the national correction does not hand you negotiating room, and waiting does not manufacture a discount in these bands.
Dimension three: the real Bay Area buyer window sits above $10M, and its cause is entirely different
There is a genuine buyer's market in the Bay Area. It is at the top. In Q2 2026 the $10M–$20M band recorded 39 closings, a median 25 days on market, and a median sale price at 96.3% of original list. The $20M+ band recorded 8 closings at a median 44 days and 91.5%. At city level the ratios agree, though days on market do not: Atherton closed at 97.1% of original list, Woodside at 97.3%, and Los Altos Hills at 97.5%, all below par — but at 13, 21, and 9 days respectively, all three ran faster than the 25-day median for the $10M–$20M band.
But this discount is not the same species as San Antonio's. Sun Belt discounts come from surplus inventory meeting carrying cost. Homes sit, owners carry a mortgage plus insurance plus property tax, and when the carry becomes intolerable the price comes down — with foreclosure data deteriorating alongside. The Bay Area's top-band discount comes from two different things. First, volume is thin: 39 and 8 sales in a full quarter means a single atypical transaction visibly moves the median. Second, pricing at this level is a discovery process by design. A singular property has no true comparable sales, so sellers routinely test the market with an ambitious number. Closing below original list is part of the procedure, not a distress signal.
The counter-evidence is sitting right beside it. All-cash share is 71.8% in the $10M–$20M band and 75.0% above $20M; Woodside runs 74.2% and Atherton 64.5%. These owners have no monthly payment. Nobody can force them to sell at a loss. So in the Bay Area, "buying the dip" is a conversation about $10M and up, not about $2M. How to actually size a discount on a specific luxury property — and which defects deserve a markdown — is the subject of a separate article.
Two data sets: how the country split, and how the Bay Area layered
National: what the deepest-discounting markets look like
The headline figures first: among the 50 largest U.S. metros in February 2026, San Antonio had 57.9% of sellers cutting price — roughly one in every two listings marking down — followed by Austin at 55.2% and Dallas at 47.3%. What those markets share is not a weak economy. It is inventory piling up: months of supply is near 12 in Miami and approaching 8 in Austin, Tampa, and Houston, against a healthy range of 5 to 6.
| Metro | Share of sellers cutting price (Feb 2026) | Other stress signals |
|---|---|---|
| San Antonio | 57.9% | Rents down 5% over twelve months, last among major metros |
| Austin | 55.2% | Months of supply near 8; Texas prices down ten straight months, Austin about −3% |
| Dallas | 47.3% | One of the large metros where the softness is spreading outward |
| Tampa | 45.9% | Months of supply near 8 |
| Fort Lauderdale | 44.9% | Statewide Florida price-cut rate 43.6% |
| Miami | — | Months of supply near 12 |
| Cape Coral–Fort Myers | — | Q1 median price down 9% year over year, to $341,250 |
| Phoenix | — | Prices down roughly 4% year over year; active listings up about 44% over three years |
| Denver | — | Prices down roughly 3.2% year over year |
What to take away: not one market in that table has a demand problem. Every one of them has a supply problem. The median Texas seller cut $25,000 in March, about 5.4% off the original price, and Texas and Florida also sit near the top of the country for foreclosure starts. Inventory, rents, and foreclosures weakening at the same time is what constitutes a market you can genuinely buy into at a discount. None of those three conditions holds in the Bay Area.
Bay Area: one quarter, seven price bands, two directions
The headline figures first: the Bay Area's $3M–$5M band recorded 822 closings in Q2 2026, a median 8 days on market, and a median sale price at 105.3% of original list. By the $10M–$20M band, closings drop to 39, median days on market stretches to 25, and the sale-to-original-list ratio falls to 96.3%. Same quarter, same market — change the price band and leverage changes hands.
| Price band | Closings | All-cash share | Median days on market | Sale price / original list |
|---|---|---|---|---|
| Under $1M | 795 | 15.5% | 15 days | 101.3% |
| $1M–$1.5M | 1,481 | 15.0% | 12 days | 103.2% |
| $1.5M–$3M | 2,515 | 15.7% | 12 days | 103.8% |
| $3M–$5M | 822 | 26.8% | 8 days | 105.3% |
| $5M–$10M | 279 | 44.4% | 8 days | 103.8% |
| $10M–$20M | 39 | 71.8% | 25 days | 96.3% |
| $20M+ | 8 | 75.0% | 44 days | 91.5% |
What to take away, in two parts. First, the Bay Area below $10M has not entered a buyer's market in any sense — 8 to 15 days to close, at 101%–105% of original list, is the mirror image of the national buyer's-market metros. Second, negotiating room above $10M is real, but read it together with the all-cash share. At 71.8% and 75.0%, this band has almost no forced sellers. Those few percentage points are not a distress discount. They are the market correcting an ambitious opening price.
The city view makes the same point more sharply. Palo Alto closed in a median 8 days at 105.6%, Los Altos 8 days at 105.1%, Sunnyvale 8 days at 107.1%, Hillsborough 8 days at 101.6%. Meanwhile Los Altos Hills ran 9 days at 97.5%, Atherton 13 days at 97.1%, Woodside 21 days at 97.3%. All three of those below-par cities sit in the Peninsula's top price tier — Atherton's Q2 median sale price was exactly $10.0M, Los Altos Hills $5.725M, Woodside $4.5M. All-cash share across this stretch of the Peninsula runs from 36.0% in Palo Alto to 74.2% in Woodside, with Hillsborough at 52.1% and Atherton at 64.5%.
What MK Group tracks each quarter
The ratio we track every quarter in Pulse: the top-band discount is structural, not new this year
MK Bay Area Pulse computes one measure every quarter: the median ratio of sale price to original list price, by price band. Line up the six quarters from Q1 2025 forward and neither band above $10M has closed above par in any of them.
The $20M+ band ran 90.7% in Q1 2025, 86.6% in Q2, 82.4% in Q3, and 93.2% in Q4. The $10M–$20M band over those same quarters ran 95.3%, 98.9%, 97.1%, and 95.6%. In Q1 2026 the two briefly converged on par — $10M–$20M at 99.0% and $20M+ at 100.0%, the only reading in the series that came close to closing the gap — and in Q2 they re-widened, to 96.3% and 91.5% respectively. The discount at the top is therefore a structural feature that has held for multiple quarters, not a turn that arrived this year. Q1 2026 is the anomaly, not Q2.
Over those same six quarters, none of the three bands between $1.5M and $10M has closed below par; in Q2 2026 they printed 103.8%, 105.3%, and 103.8%. The 100% line has sat near $10M for a year and a half. Asking whether the Bay Area is a buyer's market has no answer until you name a price band.
Do not explain the national correction and the local top-band discount with the same model
The distinction changes what you should watch. The Sun Belt discount is a function of inventory and cash-flow pressure, which means it can persist, it can deepen, and it will end when the inventory clears — so the indicators that matter there are months of supply, rents, and foreclosure counts. The Bay Area's top-band discount is a function of thin volume and price discovery. It does not track the national cycle, and it will not disappear because national prices stabilize — so the indicators that matter here are quarterly closing counts and days on market within that band.
One comparison gets overlooked. Twenty-five days sounds slow. Put back into national context, 25 days is still far faster than the true buyer's markets above, where absorption in Miami, Austin, Tampa and Houston runs 8 to 12 months. At city level it is faster still: Los Altos Hills 9 days, Atherton 13, Woodside 21. The Bay Area's top band has moved from extreme seller control to negotiable. It has never moved to unsellable. MK Group's working rule has not changed: judge the temperature of the Bay Area market using Bay Area closing data only. National indices have almost no explanatory power in the most expensive cities in the country.
Common mistakes
Mistake 1: "The national buyer's market is back, so the Bay Area must be next"
It does not transmit automatically. The national turn was built on surplus supply — more than 600,000 multifamily units completed in 2024, concentrated in the Sun Belt, pushing months of supply in Miami, Austin, Tampa and Houston out to 8 to 12. The Bay Area has no such precondition. There has been no large-scale new single-family supply here for two decades, and in Q2 2026 the $3M–$5M band still closed in a median 8 days at 105.3% of original list. Different cause, different course.
Mistake 2: "Fewer homes are cutting price, so the market is heating up again"
The opposite. The national share of listings carrying a price cut fell to 18.8% in June, 1.9 percentage points below the same month last year — while the median list price fell 2.5% year over year and posted an eighth consecutive month of year-over-year decline. Fewer markdowns is not scarcity. It is sellers changing tactics: instead of listing high and cutting later, they are launching at a realistic number. Price-cut share can mislead you. Median list price and months of supply will not.
Mistake 3: "Bay Area luxury homes are closing below asking, so the luxury band is breaking"
The $10M–$20M band at 96.3% and the $20M+ band at 91.5% are indeed below par, but all-cash share in those two bands is 71.8% and 75.0%. There are almost no owners carrying a monthly payment, so there is almost nobody who can be forced to sell into a loss. Those bands also recorded only 39 and 8 closings in the quarter, which makes the median exquisitely sensitive to any single transaction. This is thin volume plus ambitious pricing. It is a fundamentally different signal from the Sun Belt's inventory glut plus rising foreclosures.
Mistake 4: "Since the country is falling, waiting another six months in the Bay Area gets me a better price"
Below $10M, waiting does not produce a discount. The $1.5M–$3M band closed in a median 12 days at 103.8%, $3M–$5M in 8 days at 105.3%, and $5M–$10M in 8 days at 103.8% — this is a market you win by pricing above original list, not below it. Rates are also easing: Freddie Mac put the 30-year fixed at 6.43% in early July, a seven-week low and well under the 6.67% of a year earlier, with the 15-year at 5.79%. National existing-home sales rose 3.2% year over year in May to a 4.17 million annualized pace, a five-month high, with first-time buyers at 35% of purchases, the highest share in years. Over the waiting period, competition increases rather than thins.
Mistake 5: "The Sun Belt is falling, so I should go buy the dip in Texas or Florida instead"
That mistakes "prices are falling" for "worth buying." Investment value is not a price question alone. It requires rent growth, vacancy, months of supply, and foreclosure counts read together. Texas currently leads the country in foreclosure starts, with Florida, Indiana, and South Carolina also among the highest foreclosure rates. San Antonio rents fell 5% over twelve months, and the national rental vacancy rate touched 7.2%. Where price, rent, and foreclosure metrics are all weakening at once, the decline may not be finished. Out-of-state decisions of this kind require local ground-level data, not a national price-cut leaderboard.
Next steps
- Establish your price band before you ask whether it is a buyer's market. The Bay Area's Q2 2026 dividing line sits at $10M: below it, 8 to 15 days and 101.3%–105.3% of original list; above it, 25 to 44 days and 96.3%–91.5%. Cross that line and the negotiation script is a different document.
- Under $10M, delete "wait for cheaper" from your strategy. Replace it with two things that do produce openings in this band: the rate window, and specific listings that were mispriced at launch and have been sitting.
- Above $10M, anchor your discount target to this band's own data. The reference points are 96.3% of original list for $10M–$20M and 91.5% for $20M+ — not "the country is down, so I should ask for 10% off."
- When reading national coverage, substitute months of supply for price-cut share. Price-cut share is contaminated by seller listing tactics. Absorption in months — healthy at 5 to 6, a buyer's market past 6 — is harder to manipulate and turns earlier.
- When tracking the Bay Area's top band, watch closing counts rather than the median price. With samples of 39 and 8, quarter-to-quarter swings in the median are normal. Two consecutive quarters of change in the number of closings is the signal that supply and demand are actually moving.
Further reading: Buying at $10M to $14M in Atherton — why did every one of these homes close below asking? | If the AI bubble bursts, will my Bay Area home lose value? | How far over asking do I need to go to win a Bay Area home?