Quick Answer
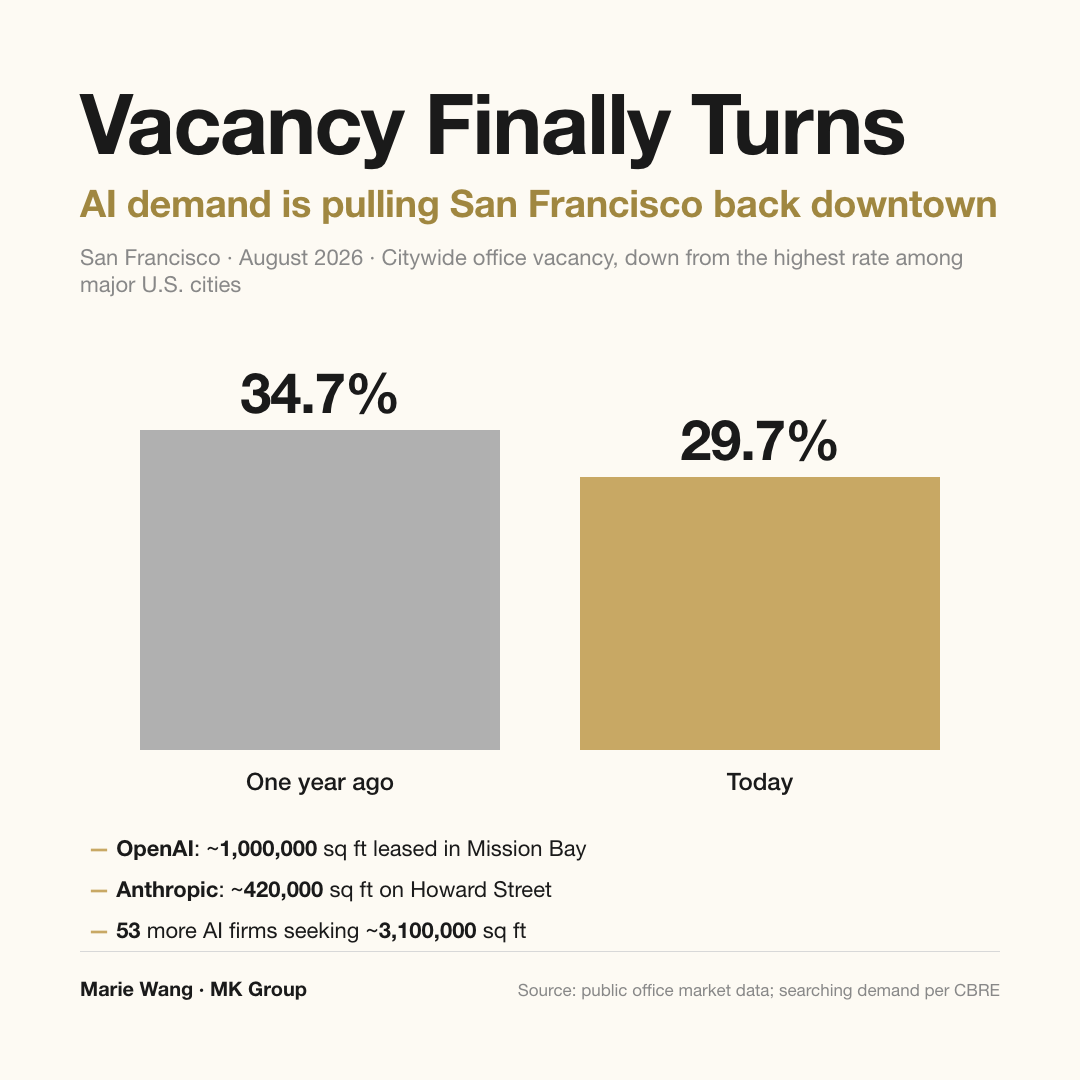
Partly. Office vacancy fell from 34.7% a year ago to 29.7%, median two-bedroom rent is back to roughly $5,500, and AI companies are still hunting for 3.1 million square feet. Retail vacancy and street conditions have not caught up. The recovery is happening block by block, not citywide.
Who this article is for
- Readers who want to separate the checkable numbers in the "San Francisco is back" story from the atmospherics
- Buyers shopping the Peninsula or South Bay who need to know how AI companies returning to the city changes commute math and housing demand
- Dual-career households with one job in San Francisco, weighing city living against Palo Alto or Menlo Park
- Peninsula and South Bay owners who want to understand what this wave of office demand means for the asset they already hold
- Families following the Bay Area from overseas or out of state, who only see headlines and want a ground-level comparison
Three ways to read the signal
One: three things came back, and each can be checked against public statistics
The least reliable evidence that a city has recovered is a headline. The most reliable is a number an outside party can check. Right now San Francisco has three of them, all pointing the same direction.
The first is office vacancy. A year ago it stood at 34.7% — the highest of any major American city. It is now 29.7%. Five percentage points in twelve months.
The second is rent. Median two-bedroom rent is roughly $5,500, up about 22% year over year, and now above where it sat before the pandemic. That last clause matters. This is not a market still sitting at the bottom of the hole; it has climbed back over the rim.
The third is that office demand has not been absorbed yet. Beyond the leases already signed, CBRE counts 53 AI companies still searching for space in the city, with combined requirements of roughly 3.1 million square feet.
The leases already signed are equally concrete. OpenAI took roughly 1,000,000 square feet in Mission Bay. Anthropic signed roughly 420,000 square feet on Howard Street — the largest single office lease in the city since the pandemic. Those two alone exceed 1.4 million square feet. The industry shift arrived alongside a change at City Hall: Daniel Lurie, who had never held public office before, was sworn in as mayor on January 8, 2025.
Two: two things have not come back — recovery is arriving one block at a time
The same walk produced the counter-evidence, and it does not get erased by the numbers above.
The first gap is retail. Walking from Union Square down Market Street, a large share of storefronts are still empty. Forever 21 is gone. The department-store complex that every visitor to San Francisco used to shop — the Westfield San Francisco Centre — has been renamed, and much of it is still marked for lease. The Anthropologie flagship in the same stretch has closed. An entire street of leasing signs does not turn over in a quarter.
The second gap is the condition of the street itself. It is dramatically better than it was during the pandemic years, but it is not back to its best. Together these two facts point to one conclusion: the city is not recovering all at once. It is recovering block by block. The Financial District has lunch lines out the door. Three streets away, storefronts are still locked. Any sentence that begins "San Francisco is now..." or "San Francisco is still..." is too coarse at this stage.
Three: what this actually means for Peninsula and South Bay buyers — commute radius, not a buying window
This is the layer people misread most often. AI is pulling high-salary jobs and physical office demand back into San Francisco. For Palo Alto, Menlo Park, Atherton and Los Altos, the first-order effect is not that capital is being drained away, and it is not a cue to go bargain-hunting in the city. It is that commute radius has to be recalculated.
During the remote-work years, plenty of families made location decisions on the assumption that distance to the office did not matter. When employers start signing hundreds of thousands of square feet of physical space again, that variable comes back. One partner now goes into San Francisco a few days a week while the other works in the South Bay, and the question shifts from "where is the best house" to "where does the math work at both ends." The relative value of the Caltrain corridor and the 101 and 280 spines gets reordered — which is precisely where the mid-Peninsula cities hold their structural advantage.
It is worth being blunt about the other half. San Francisco's price rebound and the Peninsula luxury market run on different supply logic. Pricing in the core Peninsula cities is set over the long run by school assignment, lot size, and an extremely thin resale inventory. Its correlation with San Francisco office vacancy is low. Reading a San Francisco recovery as a timing signal for a Peninsula purchase collapses two markets into one. MK Group works the Peninsula and South Bay; the point of the visit was to read an outside signal accurately, not to change markets.
The trough versus now: six indicators you can check
The headline numbers first. San Francisco office vacancy has fallen from 34.7% a year ago — the highest of any major U.S. city — to 29.7%, a five-point drop in twelve months. Median two-bedroom rent is back to roughly $5,500, up about 22% year over year and now above its pre-pandemic level. On top of that, CBRE counts 53 AI companies still searching the city for a combined 3.1 million square feet — and that figure excludes the roughly 1,000,000 square feet OpenAI already took in Mission Bay and the roughly 420,000 square feet Anthropic signed on Howard Street.
| Indicator | Pandemic trough → one year ago | August 2026 revisit |
|---|---|---|
| Office vacancy | 34.7% (still at this level a year ago; highest of any major U.S. city) | 29.7% |
| Median two-bedroom rent | Sharp decline; roughly 20% drops widely discussed | ~$5,500, up ~22% year over year, above pre-pandemic |
| AI office demand | Give-backs and footprint reductions dominated | OpenAI ~1,000,000 sq ft and Anthropic ~420,000 sq ft signed; 53 more firms seeking ~3,100,000 sq ft |
| Retail space | Forever 21 closed; the Westfield mall exited | Site renamed, much of it still for lease; Anthropologie flagship has not reopened |
| Street conditions | Persistent odor; street conditions regularly in the news | Roughly two hours on foot with almost no odor and visibly cleaner streets; still not at its best |
| Cable cars and tourism | Service suspended in 2020 | Running again, with visible queues at the turnaround (service began in 1873, 153 years ago) |
Two things to hold onto. First, 29.7% is still a very high vacancy rate. It says the trend has improved; it does not say the problem is solved. What actually decides the next leg is how much of that 3.1 million square feet of active demand converts into signed leases. Second, rent up roughly 22% in a year and prices bouncing off pandemic lows both start from a suppressed base. That is repair, not the start of a fresh upcycle — and the spread between submarkets is wide enough that inferring anything about a specific block from a citywide figure will almost certainly be wrong.
MK Group on the ground
What actually changed on the street, and what actually didn't
Marie Wang walked from Union Square down Market Street, through the Financial District, and out to the cable car turnaround — about six hours end to end. A few on-site details carry more information than any aggregate verdict.
The changes are unmistakable. Filming on Market Street a few years ago meant a scene near the bus stop that required police response. This time, two hours of walking produced almost no odor and visibly cleaner streets — far better than three or four years ago. At a Financial District intersection at lunch hour, office workers poured out in groups and restaurants had lines at the door. The tourist queue at the cable car turnaround belongs to a different world than the one that existed when service was suspended in 2020.
What has not changed is just as specific. Market Street still has entire runs of vacant storefronts. The stretch that was the Westfield mall is, in Marie Wang's words on camera, still closed and still leasing. The most telling single data point is a Financial District shop called Specialty Cafe & Bakery. Four years ago, when MK Group filmed there, its doors were shut. Going back this month, they are still shut — the sign is up, the business is not. And on the same street, the Chipotle next door and several food trucks all had long lines. In one block, demand has returned and supply hasn't caught up. That is what "recovering block by block" looks like at street level.
What a Peninsula buyer should extract from this
Most MK Group clients make their decisions in Palo Alto, Menlo Park, Atherton and Los Altos, and very few of them will buy in San Francisco because of a video. The signal is still worth tracking, for three reasons. It determines where high-salary jobs physically land over the next several years, which in turn sets a family's commute radius. It is a leading indicator of whether this cycle's AI capital converts into real, physical demand — an office lease is a long-term commitment paid in real money, which makes it harder to stage than a funding announcement. And it is a reminder to separate repair from appreciation, a distinction that matters just as much on the Peninsula.
The full walkthrough is on YouTube @MarieWang (44K+ subscribers). Putting a camera back on the same corner and then reconciling it against public statistics is something MK Group does deliberately: footage shot four years ago set beside footage shot from the same position today, checked once more against the published numbers. It beats reading headlines.
Common Misconceptions
"The AI companies are all moving in, so San Francisco office space is fully leased now"
Vacancy went from 34.7% to 29.7%. It did not go to normal. At 29.7%, nearly three out of every ten square feet of office space in the city is still empty. The 53 AI companies and their combined 3.1 million square feet are searching, not signed — how much of that converts, and into which buildings, is unknown. An improving trend and a solved problem are two different things.
"The streets look better, so the whole city has recovered evenly"
It does not follow. On one street, the Chipotle and the food trucks have long lines while Specialty Cafe & Bakery has been shut for four years running. The Financial District is busy at lunch while Market Street still carries block-long runs of for-lease signs. This recovery is moving block by block, and generalizing from any one block to the whole city will be wrong in both directions.
"San Francisco is up, so now is the time to buy in San Francisco"
There is no causal link between those two statements. San Francisco's price move started from a base suppressed during the pandemic — it reads more like repair than a new cycle. Peninsula and South Bay luxury pricing, meanwhile, is set over the long run by school assignment, lot size and extremely thin resale inventory, and it does not move in step with San Francisco office vacancy. Using one market's recovery to time another confuses two different supply-and-demand systems.
"If AI jobs return to San Francisco, demand will drain out of the Peninsula and South Bay"
The more common outcome is the opposite. Office demand returning to the city does not change which city families live in so much as how they calculate commute radius. When one partner is in San Francisco a few days a week and the other works in the South Bay, the address has to work at both ends — and under that constraint, the mid-Peninsula cities along Caltrain and the 101 and 280 corridors become more useful, not less.
"The video mentions prices up twenty-some percent year over year — can I budget off that?"
Not advisable. That was a spoken observation on camera, not a citable market statistic. It describes a bounce off pandemic-era lows rather than a new upcycle, and the variation between submarkets is very wide. Build a budget from recent comparable sales in your target city and target price band, never from a citywide year-over-year figure.
Next steps
- Track "San Francisco's recovery" as two separate index sets. One is checkable public data — office vacancy, median rent, signed office square footage. The other is ground truth — retail occupancy, street conditions. Both improving means a real recovery; one improving means you are still at halftime.
- If someone in the household has to be in San Francisco, write the commute constraint as a hard filter before you tour anything. How many days a week, the maximum acceptable one-way time, whether proximity to a Caltrain station is mandatory. Once those three numbers are fixed, the Peninsula shortlist usually contracts by more than half.
- Price a Peninsula city off that city's own comparable sales. Do not import a San Francisco or Bay-Area-wide year-over-year figure. School assignment, lot size and available inventory are the pricing variables on this corridor.
- Keep watching AI office leases as a leading indicator. Leasing space means signing a long-term contract and paying real money, so it reflects whether capital is converting into physical demand better than funding news does — and it previews where high-salary jobs will sit for the next several years.
- Separate repair from appreciation. Bouncing off a trough back to a prior level and pushing above that level are two different market states. Confirm which one you are actually looking at before you make a hold or buy decision.
Further reading: One of Us Works in SF, the Other in the South Bay — Where Should We Actually Buy? | If the AI Bubble Bursts, Will My Bay Area Home Lose Value? | Palo Alto or Menlo Park: Which One for a $5M+ School-District Buyer? | Bay Area Housing Market, First Half of 2026: Six Structural Signals in 9,611 Closings