Direct Answer
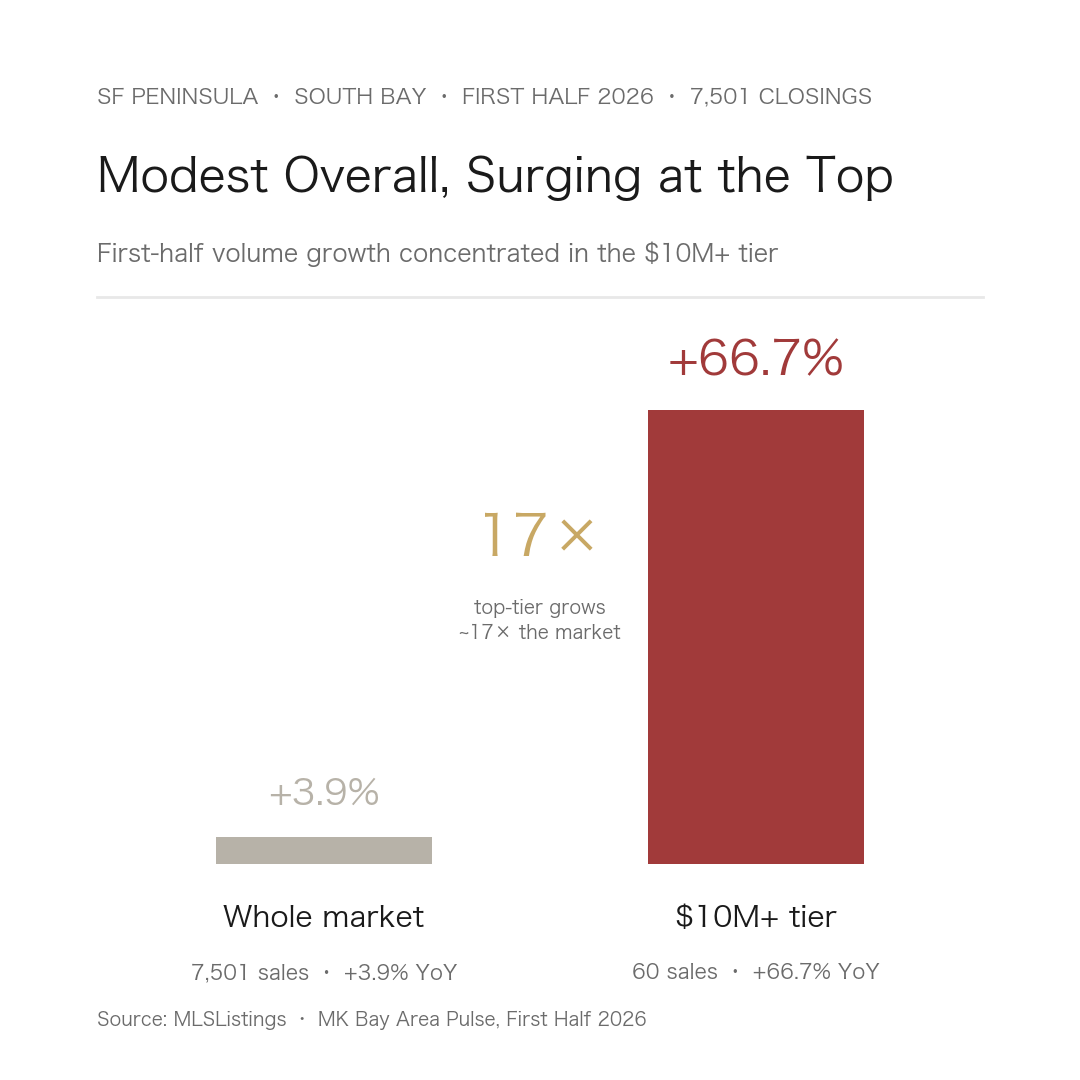
In the first half of 2026, the SF Peninsula and South Bay closed 9,611 single-family homes across three counties, up 2.7% year over year—real volume expansion, not a price bubble. But the growth was lopsided: the whole-market median rose only modestly to $1.71M, while the $10M+ tier reached 60 sales, up 66.7%—roughly 17 times the pace of the broader market. Stack Q1 and Q2 together and six structural signals emerge, sketching a half-year that was modest in total and dramatic in shape.
Who This Article Is For
- Readers tracking the Peninsula and South Bay market as a whole who want one half-year synthesis in place of scattered monthly notes.
- $5M+ and $10M+ buyers and sellers who want to know where their price band actually sits this half.
- Cross-border high-net-worth families watching how cash and leverage shift at the top quarter to quarter.
- Professionals and investors who need a sourced anchor point to reason from.
- Anyone who has read a single-quarter Pulse and wants the structural view that connects Q1 to Q2.
Six Structural Signals
Combine the two quarters and the noise smooths out; the pattern surfaces. Six signals, from total volume to the split, the cash ladder, leverage, and the mid and top tiers each running their own market.
One: modest expansion, and the spring growth was real
The 9,611 first-half closings beat last year's 9,362 by 2.7%, with most of the gain in Q2 (5,941 sales, up 3.5%; Q1 was 3,670). This was volume, not price froth—the half-year median held at $1.71M, up just 1.5% in Q2. Two tailwinds arrived together: the Case-Shiller San Francisco index flipped from −2.10% to +2.47% year over year, and the 30-year mortgage eased to 6.41%, 37 basis points below a year ago.
Two: the K-shaped split, confirmed by volume—$10M+ grew 17x the market
Read only the +2.7% headline and you miss the half's main event: almost all the growth was at the top. The $10M+ tier closed 74 sales, up 57.4% from 47 a year earlier—about 22 times the broader pace. And it showed up in transaction counts, not just prices: $10M+ jumped from 27 sales in Q1 to 47 in Q2 (+74.1%), and the $5M–$10M band leapt from 139 to 279 (+101%). The K-shape moved from a price story to a volume story—different bands, different markets.
Three: the cash ladder held all year, but the top slope shifted
"The pricier, the more cash" held throughout—an unbroken climb from about 16% all-cash below $1M, to 29% at $3M–$5M, 46.6% at $5M–$10M (Q2), 72.7% at $10M–$20M, and 83.3% above $20M. What moved was the top slope: $10M–$20M all-cash fell from 86.7% in Q1 to 72.7% in Q2, and that 72.7% is the band's first year-over-year decline on record (versus 77.8% in Q2 2025); $20M+ slipped from 100% to 83.3%. That loosening points to the next signal. The cash-decoupling mechanism is worked through for a single quarter in why luxury cash decouples from wealth.
Four: leverage returned as a tool, not a dependency
The flip side of falling top-tier cash is that financed deals came back. The $10M+ tier logged 12 financed sales for the half—but two in Q1 and ten in Q2, lifting the financed share from 9.5% to 25.6%. The driver is not empty pockets; it is opportunity cost. Equities rose about 20.9% over the year, so paying all cash means exiting a compounding position and triggering current capital-gains tax. When mortgage or securities-backed credit costs about 6.4%—below expected portfolio returns—borrowing is the cheaper move. The leverage is opportunistic, not structural, which is why $10M+ still ran 80% cash for the half.
Five: the $3M–$5M school band was the hottest, two quarters running
If the top's word is "volume," the middle's is "competition." The $3M–$5M band closed 1,002 sales for the half at the market's highest premium: 106.0% of list, with a median of just eight days on market. And it was not a one-off—Q1 (106.8%) and Q2 (105.3%) both topped the field. This price is the entry ticket to the Peninsula and South Bay's core school districts: buyers are homogeneous, supply is thin, and bidding pushes closings systematically over asking. The single-quarter breakdown is in why the mid-tier school band is the most competitive.
Six: ultra-luxury ran deep-discount to frenzy to negotiation in eighteen months
The $20M+ tier closed 12 sales for the half (nine in Atherton, two in Palo Alto, one in Woodside), double a year earlier (three in Q2 2025 versus six in Q2 2026). The number matters less than the rhythm: deep discounts in 2025, a bidding frenzy in Q1, and by Q2 negotiating room reopening from that Q1 extreme—three states in eighteen months. The six Q2 closings were themselves bimodal: priced-right homes sold in 4–18 days (two above list, +10.0% and +17.8%), while over-anchored ones exited 9–20% below list (a 90.2% median, 44 days out). The negotiation window and Atherton's specifics get their own piece; for the fuller logic of why $20M+ can close below asking, see why $20M+ homes trade below list.
Both Quarters, Side by Side
The headline numbers first: 9,611 first-half closings, up 2.7%, with most of the gain in Q2 (5,941 sales, +3.5%); a median that edged only to $1.71M; and a $10M+ tier that jumped from 21 sales in Q1 to 39 in Q2, 60 for the half—the top tier was the lead in this expansion.
| Metric | 2026 Q1 | 2026 Q2 | 2026 H1 |
|---|---|---|---|
| Closings | 3,670 | 5,941 | 9,611 |
| Year over year | — | +4.5% | +3.9% |
| Median price | $1.69M | $1.73M | $1.71M |
| Median days on market | 8 | 12 | 11 |
| Sale-to-list | — | 103.3% | 104.0% |
| All-cash share | 22.2% | 20.4% | 21.1% |
| $10M+ closings | 21 | 39 | 60 |
What to remember: the whole-market median moved only single digits year over year while top-tier counts nearly doubled—first-half growth was not a broad rise but a sharply uneven expansion. With that gap in view, the $10M+ split below explains the cash and leverage shift.
Headline numbers first: $10M+ closings rose from 21 in Q1 to 39 in Q2 (60 for the half), yet that same tier's all-cash share fell from 90.5% to 74.4% as financed deals climbed from two to ten.
| $10M+ metric | 2026 Q1 | 2026 Q2 | 2026 H1 |
|---|---|---|---|
| $10M+ closings | 21 | 39 | 60 |
| of which $20M+ | 6 | 6 | 12 |
| $10M+ all-cash share | 90.5% | 74.4% | 80.0% |
| $10M+ financed deals | 2 | 10 | 12 |
| $10M–$20M cash share | 86.7% | 72.7% | — |
| $20M+ cash share | 100% | 83.3% | — |
What to remember: even after the dip, $10M+ stayed 80% cash for the half—the top never borrows because it is short of money. When equities rise about 20.9% a year and selling stock triggers current capital-gains tax, borrowing at about 6.4% beats liquidating a compounding position. Here leverage is a tool, not a crutch. One caveat: $10M–$20M and $20M+ are small-sample tiers (a dozen-odd to single-digit sales per quarter), so quarterly ratios swing hard—the half-year figures read the trend more reliably.
Source: MLSListings (San Mateo / Santa Clara / Alameda single-family closings) · MK Bay Area Pulse 2026 Q1 & Q2 · FRED (30-year mortgage rate / S&P 500) · Case-Shiller San Francisco home-price index
Updated: 2026-07
Scope: First-half 2026 (Q1+Q2) single-family closing structure on the SF Peninsula and South Bay; cash defined by MLS "All Cash No Loans / Cash to Existing Loan," 99.2% field completeness, medians not averages.
What We See on the Ground
For MK Group co-founders Marie Wang and Kevin Mo, the half's clearest read on the Peninsula and South Bay landed squarely on Signals Four and Six: top-tier buyers usually borrow by choice, not from need; and ultra-luxury outcomes hinge on whether a home is priced to the market, not on the home itself.
On one May 2026 (Q2) Atherton off-market deal, MK acted as buyer's agent for a cross-border buyer purchasing an architect-built home in the $18M range. The buyer had the cash but chose a roughly $10M loan—against a field of mostly all-cash rivals, and despite the 30–35 day timeline and two bank appraisals that financing implied. That is Signal Four in a single transaction: when capital has a better use elsewhere, a top-tier buyer reaches for leverage as a tool. The winning offer was not the highest; it was chosen for fit and execution certainty.
Pricing decides fate in the middle too. In May 2026, MK acted as listing agent on a Midtown Palo Alto home the owner called "unremarkable"—a four-bedroom listed at $3.88M. Through pre-market outreach to an active buyer pool, community content, and a four-day open house, it closed at $4.378M, about $500K over asking (roughly +12.8%). That is the same logic behind the $3M–$5M band's 106.0% sale-to-list and the $20M+ tier's "priced-right sells in 4–18 days": in a market expanding against thin supply, premium comes from pricing and distribution, not luck.
(Cases are anonymized—exact addresses, household composition and identities are obscured; price, capital structure and features such as cross-border / off-market / pre-market build-up / over-asking come from MK Group's documented real transactions. Half-year totals and band statistics come from MLSListings and MK Bay Area Pulse.)
Common Misconceptions
Myth 1: "Volume rose 3.9%, so the Bay Area is rising across the board"
It is not a broad rise but a sharply structured expansion. The whole-market median moved only single digits year over year (+0.9% in Q2), while $10M+ counts rose 57.4%—nearly all the growth sat at the top. Reading "+2.7% total" as "my band will rise too" is the common error: in a K-shaped market, a $1.5M home and a $15M home are not on the same curve.
Myth 2: "Falling top-tier cash means luxury buyers are tapped out and the market is weakening"
The opposite. Even after the $10M+ all-cash share fell from 90.5% in Q1 to 74.4% in Q2, it held at 80% for the half. The cause is opportunity cost: equities rose about 20.9%, and paying all cash means exiting a compounding position and owing current capital-gains tax. When financing costs about 6.4%—below expected portfolio returns—borrowing is cheaper. Financed deals rising from two to ten is leverage used as a tool, not money running out.
Myth 3: "$20M+ homes are discounting, so now is the time to bottom-fish ultra-luxury"
Read it as two poles. The $20M+ Q2 median sale-to-list was 90.2%, but that average masks two fates: priced-right homes sold in 4–18 days (two above list, +10.0% and +17.8%), while over-anchored ones needed a 9–20% cut to move. The discount comes from a seller's initial mispricing, not a tier-wide markdown—chase "the discount" and you may be buying a home that was overpriced to begin with.
Myth 4: "One quarter of data is enough to call a trend"
Especially dangerous at the top. $10M–$20M and $20M+ are small-sample tiers (a dozen-odd to single-digit sales per quarter), so their ratios swing hard—$20M+ cash from 100% in Q1 to 75.0% in Q2 looks like a cliff alone but reads clearly only across the half. Half-year aggregation smooths single-quarter noise, which is why these six signals run on the 9,611-sale H1 base rather than a single quarter.
Next Steps
- Locate yourself first: confirm your price band—first-half rules differ by band, and the $3M–$5M "competition" and the $10M+ "expansion" are two different markets. For the single-quarter view, read the 2026 Q1 Bay Area market review.
- Top-tier buyers: treat "sell stock and pay cash vs. borrow at about 6.4%" as an opportunity-cost decision rather than defaulting to all cash. The mechanism is in how luxury cash decouples from wealth.
- Mid-tier school buyers: the $3M–$5M band ran 105–107% of list at eight days for two straight quarters—leave room in budget and timing for a bidding contest. See why the mid-tier school band is hottest.
- Watch both sides at the top: much of the $10M+ and $20M+ market trades off the public MLS, so listing data alone understates real activity—see Bay Area off-market listings.
- For the full data and charts: all six signals come from two quarterly reports—city detail, the cash ladder and macro indicators live in MK Bay Area Pulse 2026 Q2 and 2026 Q1.