Bay Area Housing Price Trends 2026 — Direct Answer in Four Forces
Bay Area housing price trends in 2026 are driven by four structural forces operating simultaneously. First, the rate cycle is easing gradually, with the 30-year fixed mortgage running at 6.0-6.5%, and jumbo-loan rates softening enough that $3M-$5M middle-band buyers are stepping back in. Second, inventory scarcity is persisting — the seven core Peninsula cities posted Q1 median days-on-market of just 7-11 days, with no structural shift in the seller-market regime. Third, luxury-tier divergence is widening — Atherton's Q1 median sale price of $15.7M and Cupertino's $3.43M are now effectively two independent markets, and any forecast that uses a single model across them will misread the picture badly. Fourth, cross-border capital and AI-wealth inflows have pushed all-cash share in the $5M+ band to 50-87.5% per MLSListings Q1 2026 data, effectively decoupling luxury demand from the credit cycle. Understanding 2026 requires treating the Bay Area as four distinct sub-markets (Tier 1 through Tier 4), each on its own framework.
Who This Is For
- Sellers deciding whether to list in H1 or H2 2026, or whether to wait for rates to ease further before going to market
- Buyers in the $2M-$10M band in Palo Alto, Los Altos, Cupertino, Menlo Park trying to time entry against the "now versus wait" question
- Investors allocating across price bands and trying to understand why Tier 1 and Tier 4 YoY trajectories can diverge sharply
- Cross-border families stacking the currency cycle, rate cycle, and price cycle to identify the right entry window
Force 1: The Rate Cycle — 6.0-6.5% Is the 2026 Reality
During the first half of 2026, the 30-year fixed mortgage rate fluctuated between 6.0% and 6.5% (Freddie Mac PMMS weekly, Q1 2026), a meaningful retreat from the 2024 peak above 7.5% but still well above the 2020-2021 lows of 2.65-3.5%. Jumbo-loan rates (over $766K, which applies to almost all transactions in core Peninsula cities) typically run 0.25-0.5 percentage points above conforming, putting actual buyer-faced rates in the 6.25-7.0% range.
The transmission through the market is asymmetric. The $2M-$5M band is highly rate-sensitive — every 0.5% rate move translates to a $1,000-$2,500 monthly payment swing, and "wait for rates" psychology is still strong. The $5M+ band is essentially immune, because 50-87.5% of transactions are all-cash. That is why Q1 2026 data shows Cupertino (median $3.43M) at just 21.1% cash, while Atherton (median $15.7M) is at 80% cash — same rate environment, fundamentally different market structure.
Force 2: Inventory Scarcity — The Seller-Market Regime Holds
MLSListings Q1 2026 data shows core Peninsula cities with strikingly short median days-on-market: Cupertino 7 days, Palo Alto 8 days, Menlo Park 7 days, Atherton 9 days, Los Altos 8 days. New listings are being absorbed in 7-9 days even in the pre-spring inventory low, just 2-4 days slower than the 2021-2022 peak.
The scarcity is structural. Owners who locked in 2.65-3.5% mortgages in 2020-2022 are reluctant to trade up, because moving means giving up that rate lock — a phenomenon known as the "rate lock-in effect." This force is expected to dominate Bay Area supply through 2026, and even a further rate decline to 5.8% would not move owners holding 3% loans.
Force 3: Luxury-Tier Divergence — A Three-Layer Structure
The MLSListings Q1 2026 price-band split makes the three-layer structure unmistakable:
- Lower band ($1M-$3M): 2,008 closings, 16-20% cash, jumbo-loan dominated, rate-sensitive buyers
- Middle band ($3M-$5M): 375 closings, 29.1% cash, median sale-to-original-list ratio 106.8% — the most competitive "squeeze zone"
- Upper band ($5M+): 144 closings (only 21 in $10M+), 53.7-100% cash, effectively decoupled from credit markets
Because of this structure, "the Bay Area housing market" cannot be discussed as a single thing in 2026. The lower band tracks rates and tech employment, the middle band tracks RSU vesting cycles and school-district supply-demand, and the upper band tracks AI/IPO wealth rhythms and cross-border capital windows. Their 2026 trajectories can diverge meaningfully.
Force 4: Cross-Border Capital and AI Wealth Inflows — The $5M+ Foundation
Three independent but reinforcing capital streams underwrite the $5M+ band in 2026. First, OpenAI, Anthropic, and Databricks-era RSU and secondary-market liquidity creates seven- and eight-figure cash positions among senior AI-company employees. Second, an expected IPO window — if OpenAI, Stripe, or Databricks complete listings in H2 2026 through H1 2027 — would release a new wave of employee liquidity. Third, cross-border high-net-worth families continue to allocate to Bay Area assets via family trust structures, especially during favorable currency windows.
None of these streams depend on mortgage financing, which is why $5M+ transaction volume and prices are expected to hold steady through 2026, regardless of what happens to Cupertino or Sunnyvale. The MK Group has tracked a client who in early 2024 was a $2M school-district buyer; over two years, as a top AI company's equity value surged, this client closed a $20M Atherton new-construction purchase in early 2026 — a "generational" wealth jump that traditional luxury agents tend to underestimate.
8-City Tiered Pricing (Real Q1 2026 Data)
Headline numbers first: In Q1 2026, the eight core Bay Area cities ranged from Atherton's $15.7M median (80% cash) to Sunnyvale's $2.7M median (23.9% cash) — a 5.8x price spread and a nearly 4x cash-share spread. These are two different markets sharing one geography.
Tier 1: Ultra-Luxury $10M-$30M+ (Atherton, Old Palo Alto, West Atherton)
Tier 1 is represented by Atherton (Q1 2026 median $15.7M, 80% cash, 9 days DOM, 10 closings). Buyers are almost entirely senior AI executives, VC partners, family offices, and cross-border ultra-high-net-worth. Old Palo Alto and West Atherton as Atherton's top sub-communities push median prices further into the $20M-$30M+ range. The MK Group helped one client buy a 7,000-square-foot older home in West Atherton for around $12M in 2023; three years later, market valuation is approximately $18M — a hold-period appreciation of more than 50%, illustrating that "low liquidity does not equal low appreciation" at the top of the Atherton stack. Tier 1 trajectories in 2026 are driven by AI/IPO wealth rhythms and have minimal correlation with mortgage rates.
Tier 2: High-End Luxury $5M-$15M (Hillsborough, LAH, Woodside, Crescent Park)
Tier 2 includes Hillsborough (median $5.92M, 63.2% cash, 19 closings), Los Altos Hills (median $5.23M, 50% cash, 12 closings), Woodside (median $10.5M, 71.4% cash, 7 closings), and the Crescent Park sub-community of Palo Alto (embedded in Palo Alto totals, typically $5M-$10M). Buyers are predominantly tech families upgrading from a Tier 3 home, and capital structure tilts toward all-cash. The 2026 full-year outlook is for modest volume gains and median price appreciation of 5-10%.
Tier 3: Core Luxury $3M-$8M (PA Midtown, South PA, Menlo Park, Los Altos)
Tier 3 is the most competitive band in 2026. Palo Alto overall posts median $4.12M (50.8% cash, 8 days DOM, 61 closings), Menlo Park median $3.4M (41.5% cash, 53 closings), Los Altos median $5.08M (28% cash, 50 closings). The buyer mix is dual-income FAANG and AI middle management with school-district upgrade needs, and median sale-to-original-list ratios run 106.6-110% (Q1 MLSListings). Bidding pressure is at its peak. The 2026 forecast is +3-7% on median price, with internal divergence: 10/10 GreatSchools districts +5-10%, peripheral schools flat.
Tier 4: Tech-Employment Driven $2M-$5M (Cupertino, Sunnyvale)
Tier 4 covers Cupertino (median $3.43M, 21.1% cash, 7 days DOM, 38 closings) and Sunnyvale (median $2.7M, 23.9% cash, 8 days DOM, 88 closings). This band is heavily tech-employment and jumbo-loan dependent, with the highest rate sensitivity in the Peninsula. If 2026 rates trend below 5.8%, this band could rise 6-10%; if rates rebound above 7%, growth may stall at 0-3%. Cupertino's additional anchor is the FUHSD top school district (Lynbrook, Monta Vista, Cupertino HS), where Chinese-buyer concentration provides a stable demand floor.
8-City Core Data Comparison (MLSListings Q1 2026)
Headline first: Atherton's $15.7M median is 5.8x Sunnyvale's $2.7M; Atherton's 80% cash share is 3.8x Cupertino's 21.1%; yet DOM in both cases sits between 7 and 9 days — meaning that regardless of band, any property that matches its target buyer gets absorbed by the Bay Area market in roughly a week.
| City | Q1 Closings | Median Price | Cash % | Median DOM | Sale/Orig Ratio |
|---|---|---|---|---|---|
| Atherton | 10 | $15.7M | 80.0% | 9 | 100.8% |
| Woodside | 7 | $10.5M | 71.4% | 10 | 100.4% |
| Hillsborough | 19 | $5.92M | 63.2% | 11 | 100.3% |
| Los Altos Hills | 12 | $5.23M | 50.0% | 14 | 99.5% |
| Los Altos | 50 | $5.08M | 28.0% | 8 | 104.4% |
| Palo Alto | 61 | $4.12M | 50.8% | 8 | 106.7% |
| Cupertino | 38 | $3.43M | 21.1% | 7 | 109.3% |
| Menlo Park | 53 | $3.40M | 41.5% | 7 | 109.1% |
| Sunnyvale | 88 | $2.70M | 23.9% | 8 | 109.8% |
Counter-intuitive insight: Cupertino and Sunnyvale show sale-to-original-list ratios (109.3-109.8%) materially higher than Atherton's 100.8%. This is not because Tier 4 is "hotter" — it is because Tier 4 buyers are jumbo-loan-leveraged and willing to bid up to lock in a property, while Tier 1 all-cash buyers settle most of the price during private negotiations before listing, so the recorded list price is much closer to the final sale.
Note that MLSListings data excludes pure off-market transactions that never enter MLS. Industry estimates put off-market activity in the $5M+ band at roughly 15-25% above public closings (MK Bay Area Pulse Q1 2026), so true Tier 1 and Tier 2 transaction volume is likely 15-25% above the table above.
Three Full-Year 2026 Scenarios
The 2026 forecast hinges on three variables: the rate path, the AI-wealth rhythm, and macro recession risk. Based on MLSListings historical patterns and the current market structure, the MK Group lays out three scenarios:
Baseline (55% probability): Moderate Appreciation +3-6%
Core assumptions: 30-year fixed stays in the 6.0-6.5% range; the U.S. economy soft-lands (GDP +1.5-2.5%); top AI valuations stabilize; OpenAI and Stripe IPO progress is measured. Peninsula core 7-city aggregate +3-6%, Tier 1 +5-10%, Tier 2 +5-8%, Tier 3 +3-7%, Tier 4 +2-6%. Inventory scarcity persists; DOM holds at 7-10 days. This is the most likely outcome.
Bullish (25% probability): AI Wealth Surge +8-12%
Core assumptions: 30-year fixed drops below 5.8%; OpenAI completes its IPO in H2 2026, releasing employee liquidity; Anthropic and Databricks follow with secondary-market activity; top AI company revenue continues growing 50%+, triggering another equity-value step-up. Peninsula core 7-city aggregate +8-12%, Tier 1 +12-18% (Atherton median could exceed $18M), Tier 2 +10-15%, Tier 3 +6-10%, Tier 4 +6-10%. Inventory tightens further; DOM compresses to 5-8 days.
Bearish (20% probability): Recession plus Rate Rebound -2% to +2%
Core assumptions: 30-year fixed rebounds above 7%; U.S. enters recession (GDP < 0%); AI valuations correct 20-30%; large-scale tech layoffs resume. Peninsula core 7-city aggregate -2% to +2%, Tier 1 flat to +5% (all-cash buyers unaffected by rates but volume contracts), Tier 4 -3% to -1% (tech employment and jumbo loans hit simultaneously). Inventory rises; DOM extends to 15-25 days.
The decisive variables between scenarios are the Q2-Q3 rate path and the AI-company IPO calendar. If Q3 30-year fixed remains stable at 6.0-6.5% with no recession signals, baseline probability rises to 65%+.
Cross-Border Capital and Four Luxury-Tier Drivers
Four independent but reinforcing factors anchor the $5M+ band in 2026:
- AI wealth effect: OpenAI, Anthropic, xAI, and Databricks valuations stepped up during 2024-2026; core-employee secondary-market liquidations of $5M-$20M flow directly into Atherton, Old PA, and LAH
- IPO window expectations: If OpenAI, Stripe, and Databricks complete IPOs between H2 2026 and H1 2027, the next wave of employee liquidity will further lift Tier 1-2 demand
- Cross-border compliance pathways: Family-trust and pre-immigration planning structures matured during 2024-2025; cross-border ultra-high-net-worth families now have a clear compliant route into Bay Area assets, continuing to underwrite Tier 1 off-market activity through 2026
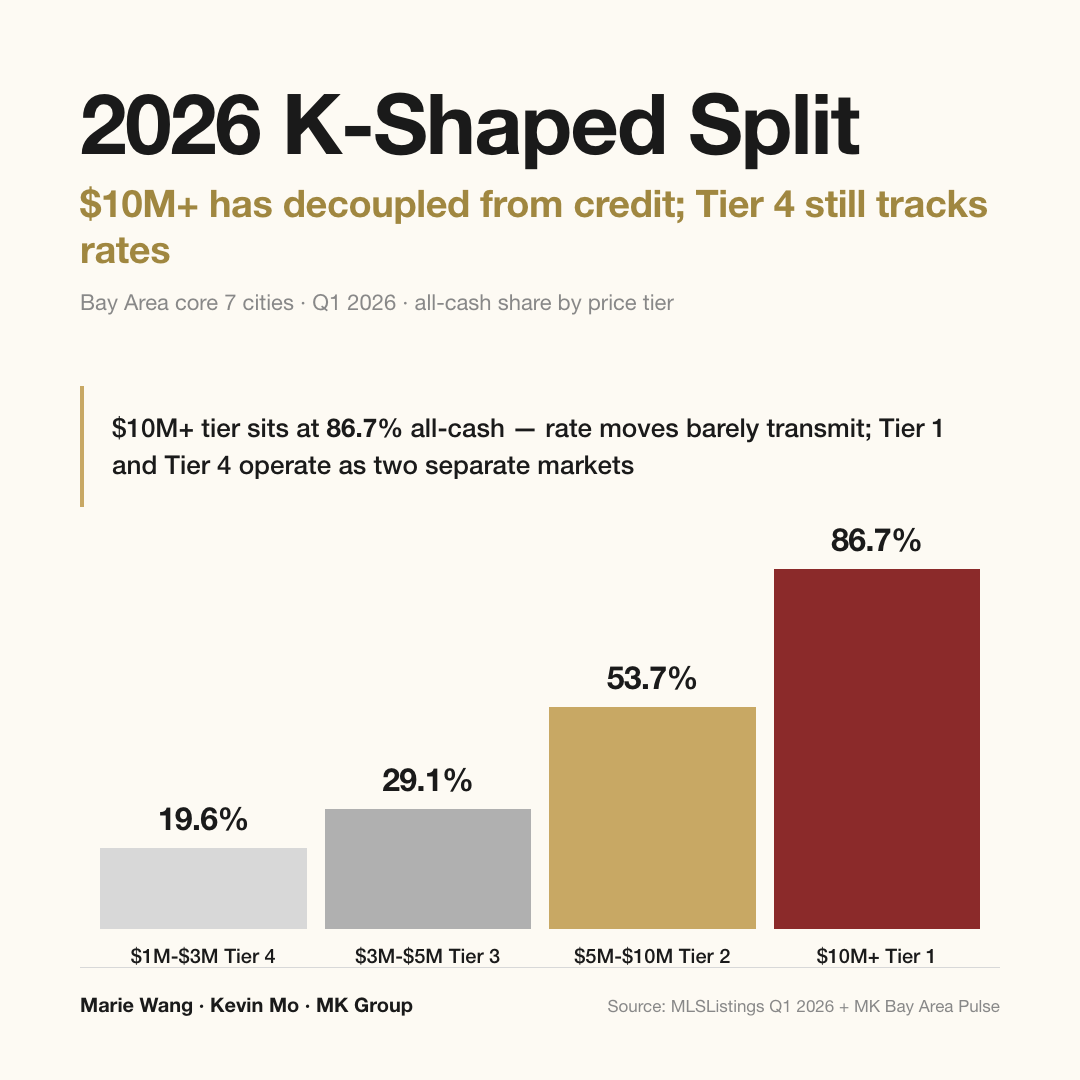
- Cash-share ladder: MLSListings Q1 data shows a non-linear jump from 19.6% cash in the under-$1M band to 100% cash in the $20M+ band. The 86.7% cash share in $10M+ means luxury has effectively detached from the credit market, with negligible rate sensitivity
5 Common Pitfalls
Pitfall 1: Asking "By how much will Bay Area prices rise?"
The question is framed wrong. Atherton and Sunnyvale could move in completely opposite directions in 2026 (bullish scenario: Atherton +15%, Sunnyvale +8%; bearish: Atherton flat, Sunnyvale -2%). Any "Bay Area average +X%" projection lacks actionable resolution. Buy-sell decisions need to drop to the city level, and in some bands to the sub-community level.
Pitfall 2: Treating "wait for lower rates" as a universal strategy
The $5M+ band, with 50-87.5% cash share, sees minimal demand transmission from rates. The Tier 4 band is rate-sensitive, but a 0.5% rate cut releases buyer demand that immediately absorbs into a 3-5% price bump. The true beneficiaries of "waiting for rates" are marginal buyers who already have down payment and income ready — not the indecisive.
Pitfall 3: Using Zillow Zestimate or Redfin Estimate for fine valuation
These algorithms are reasonably accurate in Tier 4 (Cupertino, Sunnyvale) with 5-10% error, but in Tier 1-2 (Atherton, Hillsborough, LAH) errors routinely reach 20-40%, because off-market activity is high, comparables are thin, and land value dominates. Real valuations in Tier 1-2 require agent-driven private comps and recent off-market verification.
Pitfall 4: Short DOM means no room to negotiate
Atherton's Q1 median DOM is 9 days but the sale-to-original-list ratio is 100.8% (essentially no premium); Cupertino DOM is 7 days but the ratio is 109.3%. Short DOM does not equal "absolute seller leverage" — Tier 1 has short DOM because there are few buyers and off-market dominates, so the public listing window is brief because the negotiation already happened privately. Tier 4 is the true "list and bid" market. Whether you can negotiate is reflected in sale-to-original-list ratio and list price strategy, not DOM.
Pitfall 5: Extrapolating the past 3 years into 2026
Between 2023 and 2025, Atherton median moved from roughly $12M to roughly $18M (+50%), but that resulted from the AI wealth surge, high rates, and extreme inventory scarcity stacking simultaneously. The probability that all three factors remain at extreme values through 2026 is moderate at best — under the baseline scenario, Atherton +5-10% is a more realistic expectation. Past three-year gains were cyclical, not structural.
Frequently Asked Questions
Q: Will Bay Area prices be cheaper in H1 2026 than H2?
Not necessarily. Q1 2026 already shows Tier 4 buyers front-running the rate cut (Cupertino median DOM of 7 days, sale-to-list ratio 109.3%), meaning the "wait for H2 lower rates" strategy is being arbitraged in real time. If rates do fall below 5.8% in H2, Tier 4 prices will likely bounce 3-5%, offsetting whatever H1 patience saved you. Tier 1-2 bands are decoupled from rates year-round; H1 vs H2 differences depend on AI/IPO timing, not on months.
Q: Why is Atherton at $15.7M and Sunnyvale at $2.7M — a 5.8x spread?
Atherton's median reflects 1-acre minimum lots, estate-grade older homes, top private schools (Sacred Heart, Menlo School corridor), and buyers who are 80% all-cash, drawn from AI, VC, and cross-border ultra-high-net-worth. Sunnyvale's median reflects 5,000-8,000 square-foot lots with tech-commuter housing, where buyers are 78% jumbo-loan financed and come from Apple, Google, and Meta engineering ranks. The two cities are not in the same market in any meaningful sense.
Q: If rates fall below 5%, will Bay Area prices spike?
Tier 4 (Cupertino, Sunnyvale) would likely jump 8-15%, because monthly payment dynamics are material to that buyer pool. Tier 3 (PA Midtown, Menlo Park, Los Altos) +5-10% as jumbo-loan leverage partially releases. Tier 1-2 bands +0-5%, because they were never mortgage-driven. The Bay Area aggregate would likely climb 6-10%, but highly unevenly.
Q: Can cross-border buyers still purchase Bay Area property in 2026?
Yes. Family-trust and pre-immigration planning structures matured during 2024-2025 with clear compliant pathways. The key 2026 challenges are the currency window (RMB weakness raises entry cost), capital outflow timing (some channels take 3-6 months), and trust setup time (2-4 months). Starting planning 6-9 months ahead maximizes window optionality. Specific execution touches tax and ownership-structure questions and should be confirmed with cross-border counsel and CPA teams.
Q: Atherton had only 10 Q1 closings — is the market shrinking?
No. Atherton single-quarter MLS closings normally run in the 8-15 range (the entire city has only roughly 2,500 single-family homes), and Q1's 10 is in the normal band. Once you account for the 15-25% Tier 1 off-market share estimated in MK Bay Area Pulse Q1 2026, true Atherton Q1 closings were likely 12-15, in line with historical averages. The "market temperature" for Tier 1 is read through sale-to-original-list ratio and DOM, not absolute closing volume.
Next Steps
- Identify your target tier (1 / 2 / 3 / 4) and apply the appropriate framework instead of asking "what will the Bay Area average do?"
- For Tier 4 buyers: set both an acceptable rate (e.g., 6.25%) and an acceptable price range; execute on whichever arrives first instead of waiting for both
- For Tier 1-2 buyers: invest in two or three first-tier agent private network relationships; the truly scarce inventory does not appear on MLS
- For Tier 3 sellers: front-load staging, content, and pricing into a high-density first-week launch to capture the 106%+ sale-to-original-list window
- For cross-border families: begin trust and capital-channel planning 6-9 months in advance, stacking currency, rate, and price cycles to time entry
Bay Area Housing Price Trends — Related Deep Dives
This article is the top-level frame for Bay Area housing price trends in 2026. For more depth on each layer:
- 📊 Bay Area Market Hub — Real-time city-level data with monthly refreshes
- 📈 2026 Bay Area Price Forecast — Rate, inventory, and AI-wealth scenario analysis
- 📑 MK Bay Area Pulse · Q1 2026 Quarterly Market Intelligence — Full 2,986-closing MLS dataset
- 💰 Bay Area Seller Pricing Strategy — Three-tier pricing and first-week data-driven adjustments
- 📅 Bay Area Home Selling 1-Week Sprint Plan — From preparation to launch
- 🏙️ Selling in Palo Alto: Pricing, Staging, First-Week Rhythm — Tier 3 seller playbook
- 🏠 Buying in Palo Alto: 7 Sub-Communities, Differentiated Strategy — Tier 3 buyer playbook