Direct answer
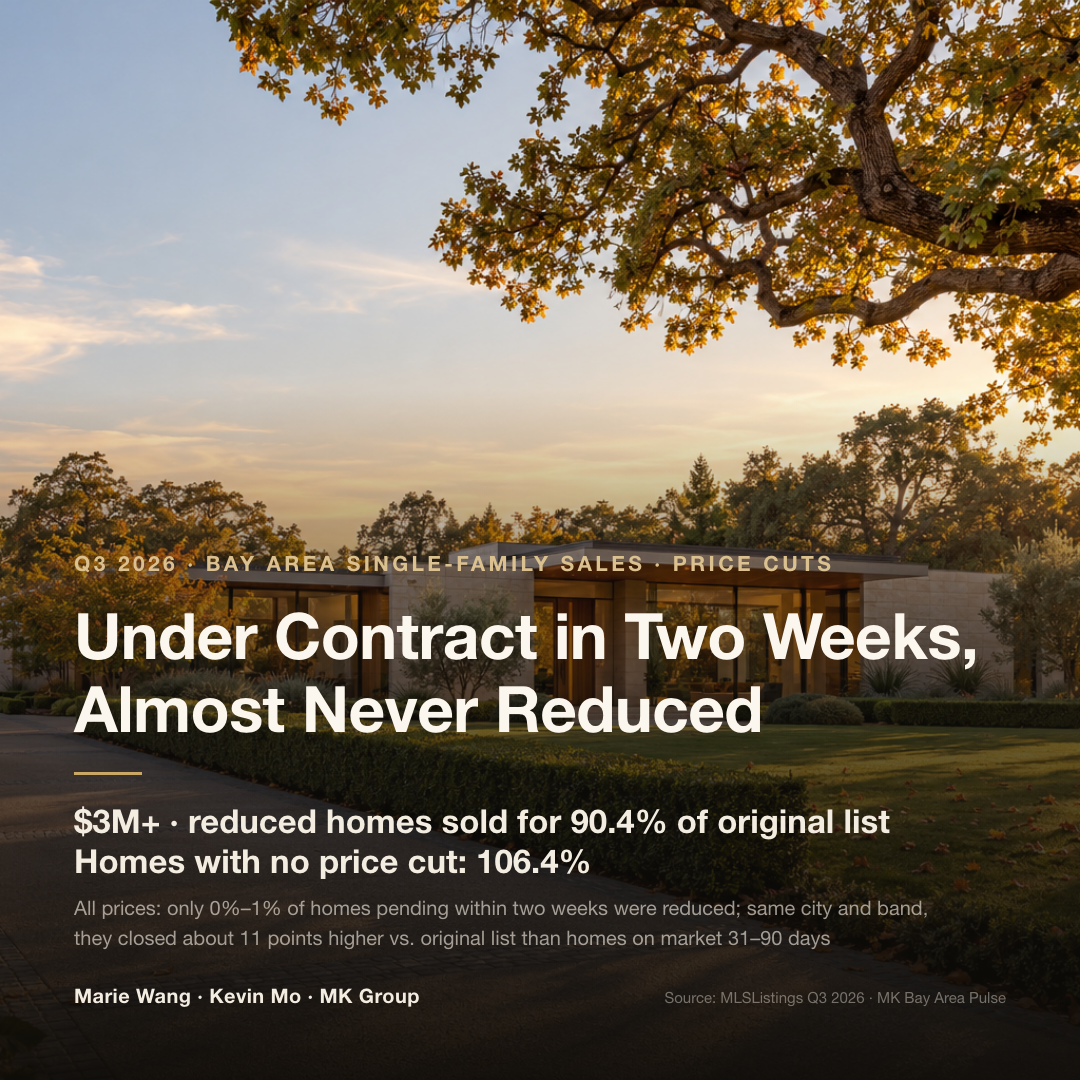
Hold off for now. Among Q3 2026 single-family closings above $3 million in three Bay Area counties, homes that took a price cut sold for a median 90.4% of their original list price — roughly 90 cents on the dollar — while homes with no cut sold for 106.4%; across all price points, the split was 91.8% against 103.8% (MLSListings). If two weeks pass without a serious offer, review the list price and the buyer feedback first, and adjust only once you are sure price is the problem.
The divide tends to show up in the first two weeks. In the $3M–$5M and $5M–$10M bands, homes with no cut went pending in a median of just 8 days. Across all price points, comparing within the same city and price band, homes that went under contract within two weeks (14 days or fewer from listing to pending) closed at a sale-to-original-list ratio about 11 percentage points higher than homes on market 31–90 days, in each of the three quarters studied. That is correlation: it cannot separate overpricing from a house that is simply harder to sell. The safer course is to get the price right before the listing goes live. Above $10 million, even homes with no cut spent a median 20–30 days on market (small sample; direction only), so two weeks without a contract is common at that level.
Who this article is for
- Owners preparing to sell a single-family home above $3 million in Palo Alto, Los Altos, Menlo Park, Atherton, Hillsborough, Saratoga, Cupertino, or another Peninsula or South Bay town, who are settling the list price with their listing agent — including owners abroad who are selling remotely through an agent
- Owners whose home has been on the market a week or two, drawing plenty of showings but no serious offer — or listed for more than a month and already reduced once — who are weighing the next move
- Owners of $10 million-plus homes in Atherton, Los Altos Hills, Woodside, and nearby towns who want to know where in the process a discount at that level tends to appear
Three things that decide what a price cut costs
Whether to cut, and what the house sells for if you do, comes down to three questions: how long it has been on the market, which price band it sits in, and where the sale price lands after the cut. The figures below are MLSListings single-family closings in three counties — Santa Clara, San Mateo, and Alameda — centered on Q3 2026, with Q3 2025 and Q2 2026 for comparison. Throughout, a "reduced" home is one whose final list price was below its original list price. The "total reduction" is how far the list price fell from original to final, whether in one cut or several. "Sale-to-original-list ratio" means the median of sale price divided by original list price. And "within two weeks" means 14 days or fewer of MLS days on market, counted from listing to pending.
One: time on market — homes under contract within two weeks hold the highest ratio
In Q3 2026, homes that went pending within two weeks sold for a median 105.8%–106.7% of original list price. Homes on market 15–30 days sold for 100.0%; beyond 90 days, 90.5% (the full breakdown is in the days-on-market table below). Almost none of the homes pending within two weeks had been reduced — 0% and 1% — against half of homes on market 31–60 days and 77% of those beyond 90 days.
A median across all homes folds in the differences between cities and price bands, so here is a second comparison. Within a single city and a single price band, it sets homes that went pending within two weeks against homes on market 31–90 days — counting a city-and-band pair only when each side has at least 3 sales — then weights the average by the smaller side's count. Homes pending within two weeks came out 10.8 points higher (Q3 2025, 83 pairs), 11.7 points higher (Q2 2026, 74 pairs), and 11.3 points higher (Q3 2026, 77 pairs). In all three quarters, the gap sat at about 11 points.
This curve shows correlation only. Homes that need a price cut often have problems of their own — condition, lot, or road frontage — and the data cannot separate overpricing from a house that is simply harder to sell; the controlled comparison holds only city and price band constant. The MLS export also has no price-cut dates, so it cannot measure how long to wait before cutting. What it does show: in each of the three quarters studied, homes pending within two weeks sold for a median above 100% of original list, and past two weeks the ratio heads steadily down.
Two: price band — fewer cuts above $3M, but a wider gap when they happen
Below $10 million, the higher the price band, the fewer homes take a cut: in Q3 2026 the share fell from 22.2% under $1 million to 12.9% in the $3M–$5M band and 12.2% at $5M–$10M. The reduced homes, though, trail unreduced ones by more. In the $3M–$5M band, reduced homes sold for a median 91.2% of original list and unreduced homes for 107.3%, a 16-point gap. Above $3 million as a whole, it was 90.4% against 106.4%, with a median 69 days on market against 8.
Above $10 million, only 7 of 41 closings had been reduced — too few to draw a conclusion. At that level, the discount can also arrive with no change to the list price on record: in the Atherton case below, the MLS record at closing shows the same original and final list price.
Three: after the cut — most reduced homes still sell below the new price, and the longer they sit, the lower the ratio
After a cut, most homes still sell below the reduced list price. In Q3 2026, only 37.3% of reduced homes sold at or above their reduced list price, while 67.4% of unreduced homes sold above list. The median total reduction from original to final list price was 6.3%, and reduced homes then sold for a median 98.2% of the final list price: once the list price comes down, the seller usually gives up a little more at closing.
Among reduced homes, the sooner the contract, the higher the ratio. In Q3 2026, the 163 that went pending within 30 days sold for a median 93.5% of original list and 99.4% of the reduced list price; the 389 at 31–60 days, 92.7% and 98.7%; the 235 at 61–90 days, 91.4% and 97.8%; and the 170 beyond 90 days, 88.5% and 97.1%. The other two quarters ran the same direction: from within 30 days to beyond 90, the ratio fell from 93.4% to 87.2% in Q3 2025 and from 94.6% to 89.1% in Q2 2026. This, too, is correlation only — a house that keeps not selling may have problems beyond price — and with no price-cut dates in the data, it cannot tell an early cut from a late one.
Q3 2026: reduced and unreduced homes, side by side
How the data is built: MLSListings closed single-family sales in Santa Clara, San Mateo, and Alameda counties, by closing date — Q3 2026 runs July 1 through September 30. Under MK Bay Area Pulse pipeline rules, records are deduplicated by MLSNumber and sales under $100,000 are removed. Only records with both an original and a final list price are counted: 5,027 for Q3 2026, against 5,098 in the published Pulse total. Total reduction = 1 − final list price ÷ original list price; sale ÷ final list = sale price ÷ final (reduced) list price.
The headline numbers: 19.0% of three-county single-family closings in Q3 2026 had taken a price cut. Reduced homes sold for a median 91.8% of original list and unreduced homes for 103.8%, with median days on market of 53 against 11. Against Q3 a year earlier, the share of reduced homes fell from 21.1% to 19.0%; reduced homes sold for 91.5% of original list then, essentially unchanged.
| Quarter (three-county single-family) | Share reduced | Reduced: sale ÷ original list | Unreduced: sale ÷ original list | Median days on market (reduced / unreduced) | Median total reduction | Reduced: sale ÷ final list |
|---|---|---|---|---|---|---|
| Q3 2025 | 21.1% | 91.5% | 102.6% | 51 / 12 | 6.3% | 97.8% |
| Q2 2026 | 13.9% | 92.5% | 105.1% | 41 / 10 | 6.3% | 99.2% |
| Q3 2026 | 19.0% | 91.8% | 103.8% | 53 / 11 | 6.3% | 98.2% |
What to take from this: Q2 2026 is the spring peak season, when the share of reduced homes runs naturally lower (13.9%), so it is not compared with third quarters for trend; the year-over-year comparison is Q3 2025 against Q3 2026 only. In all three quarters, the median total reduction was 6.3%, reduced homes sold for 91.5%–92.5% of original list, and unreduced homes for 102.6%–105.1%. A reduced home, in other words, sold for a little over 90 cents on the dollar of its original list price. Most reduced homes did not reach their new price, either: in Q3 2026, only 37.3% of reduced homes sold at or above the reduced list price, against 31.3% in Q3 2025 and 44.3% in Q2 2026.
Broken out by price band, homes above $3 million were reduced less often, but the gap was wider when they were. In the $3M–$5M band, 75 of 583 sales had been reduced (12.9%), selling for a median 91.2% of original list against 107.3% for unreduced homes. In the $5M–$10M band, 22 of 180 had been reduced (12.2%), at 90.4% against 103.7%.
| Price band (single-family, Q3 2026) | Sales | Reduced | Share reduced | Reduced: sale ÷ original list | Unreduced: sale ÷ original list | Median days on market (reduced / unreduced) |
|---|---|---|---|---|---|---|
| Under $1M | 842 | 187 | 22.2% | 91.9% | 102.8% | 56 / 13 |
| $1M–$1.5M | 1,347 | 279 | 20.7% | 92.2% | 103.0% | 52 / 12 |
| $1.5M–$3M | 2,034 | 387 | 19.0% | 91.7% | 103.8% | 51 / 11 |
| $3M–$5M | 583 | 75 | 12.9% | 91.2% | 107.3% | 62 / 8 |
| $5M–$10M | 180 | 22 | 12.2% | 90.4% | 103.7% | 72.5 / 8 |
| $10M+ | 41 | 7 | 17.1% | Sample too small | Sample too small | 103–147.5 / 20–30 |
What to take from this: above $3 million combined, 804 homes sold and 12.9% had been reduced, at 90.4% against 106.4%, with median days on market of 69 against 8 and a median total reduction of 6.7%. Above $5 million, 221 sold and 13.1% had been reduced, at 88.7% against 103.4%, and 80 days against 9. The reduced-home ratio happens to be 90.4% both for the $3M+ total and for the $5M–$10M band alone. In the upper bands, unreduced homes went pending in a median 8 days, while reduced homes in the $3M–$5M and $5M–$10M bands took 62 and 72.5 days: within the same price band, a smooth sale and a stalled one end up far apart. Above $10 million, only 7 of 41 sales had been reduced, so that row shows counts and days on market only, with no conclusion. Its days-on-market figures are the separate medians for the $10M–$20M and $20M+ tiers (103 and 147.5 days for reduced homes; 20 and 30 for unreduced).
By days on market, Q3 2026 homes that went pending within two weeks sold for a median 105.8%–106.7% of original list; at 15–30 days, 100.0%; beyond 90 days, 90.5%.
| Days on market | Q3 2025 sale ÷ original list | Q2 2026 sale ÷ original list | Q3 2026 sale ÷ original list | Q3 2026 share reduced |
|---|---|---|---|---|
| 0–7 days | 105.0% | 106.9% | 105.8% | 0% |
| 8–14 days | 104.9% | 106.9% | 106.7% | 1% |
| 15–30 days | 98.9% | 100.0% | 100.0% | 15% |
| 31–60 days | 95.1% | 95.9% | 95.7% | 50% |
| 61–90 days | 92.7% | 92.5% | 93.0% | 70% |
| More than 90 days | 89.1% | 90.7% | 90.5% | 77% |
What to take from this: the curve has nearly the same shape in the other two quarters — 104.9%–106.9% for homes pending within two weeks, 89.1%–90.7% beyond 90 days. Seasonality shifts the share of reduced homes; the curve itself barely moves. And the longer a home is on the market, the more likely it has been reduced: 15% at 15–30 days, 50% at 31–60, 77% beyond 90.
By city, the Q3 2026 share of reduced homes varied widely. In Atherton, 1 of 20 closings had been reduced (5.0%); in Palo Alto, 10.8%; in Menlo Park, 11.3%. Saratoga was at 26.5%, and Portola Valley at 6 of 18 (33.3%).
| City (Q3 2026, single-family, all prices) | Sales | Reduced | Share reduced | Median sale price |
|---|---|---|---|---|
| Atherton | 20 | 1 | 5.0% | $12.12M |
| Palo Alto | 102 | 11 | 10.8% | $4.20M |
| Menlo Park | 71 | 8 | 11.3% | $3.61M |
| Los Altos Hills | 28 | 4 | 14.3% | $6.62M |
| Los Altos | 68 | 11 | 16.2% | $4.91M |
| Cupertino | 57 | 12 | 21.1% | $3.06M |
| Hillsborough | 31 | 7 | 22.6% | $6.60M |
| Woodside | 22 | 5 | 22.7% | $4.04M |
| Saratoga | 68 | 18 | 26.5% | $4.27M |
| Portola Valley | 18 | 6 | 33.3% | $5.15M |
What to take from this: the table covers all price points, and each city records only 18 to 102 sales a quarter, so single-quarter shares swing widely — read it as direction only. Counts include only records with both list prices, slightly fewer than in the Pulse city table (Atherton, for example, 21 → 20). A low reduction share does not rule out a discount somewhere else. Only 1 Atherton sale this quarter had been reduced, yet in the Atherton case below, the MLS record at closing shows no change to the list price, and the home sold for 88.9% of it.
Three things to keep in mind when reading these numbers. First, this is correlation: homes that need a price cut often have problems of their own — condition, lot, or road frontage — and the data cannot separate overpricing from a house that is simply harder to sell; the controlled comparison holds only city and price band constant. Second, some cases go uncounted: when a home is withdrawn and relisted under a new MLS number, its price-cut history and days on market reset, so this analysis cannot see them, and the reduction shares in these tables run low; the export also has no price-cut dates. Third, these are closed sales, not a forecast, and the samples above $10 million and for individual towns are small. Full quarterly data by city and price band is in MK Bay Area Pulse, Q3 2026. The same MLSListings data, read from the buyer's side, is in whether a seller will discount a $5M Bay Area home for an all-cash buyer.
What MK Group sees in practice
Two MK Group cases speak to the two steps that come before touching the list price: having buyers lined up before launch, and finding out why buyers passed before cutting.
Before launch: Midtown Palo Alto, listed at $3.88M, sold at $4.378M
In May 2026, a four-bedroom single-family home in Midtown Palo Alto closed — a house its owner described as unremarkable, with no serious flaws and nothing that stood out. It was listed at $3.88 million and sold for $4.378 million, about 12.8% over the asking price. There were a little over two months between signing the listing agreement and going live, and MK Group, as the seller's agent, used them for three things. It looked for buyers privately before launch, and one buyer had already made a verbal offer of $4 million at the off-market stage. It built interest with its own media content ahead of the listing. And it held four days of open houses, drawing about 110 groups of visitors. MK Group's review of the sale credits the premium to those three steps working together.
What the case shows is the step that comes before any price cut: the gap between signing and listing does not have to be dead time. It can be used to build interest and find the buyers who want the house before it reaches the open market. The full review is in how much more the same Palo Alto house can sell for with a different listing agent.
Feedback before a cut: an East Atherton home an MK client toured and passed on
An East Atherton single-family home listed at $13.5 million eventually sold for $12 million, about 88.9% of list. The MLS record at closing shows the same original and final list price, $13.5 million, and 20 days on market. That record may cover only the relisting after a house-number change; the price and days from any earlier listing period are not visible. MK Group, acting as buyer's agent, had shown the home to a client, who decided not to buy for two reasons: the front door faced a main road, and the house number — some buyers have preferences about house numbers. MK Group gave the listing agent the full feedback on why the client passed. The seller then applied to the town to change the house number, and the home later sold. MK Group was not a party to that sale.
The case makes two points. First, above $10 million, the discount can come through offer negotiation: the closing record shows no change to this home's list price, yet it sold for 88.9% of it. At this level, the share of reduced homes alone does not tell you how far the sale price landed from the list price. Second, before touching the list price, get the buyers' feedback on why they didn't buy, and sort the objections into two kinds. Some can likely be fixed through a formal process, like the house number (the rules vary by city; Atherton, where this home sits, allows owners to apply to the town). Others are permanent discounts, like a front door facing a main road. Fix what can be fixed first; the price then only has to answer for what cannot. The full list of what to mark down is discussed in why Atherton homes at $10M+ close below asking, and what to mark down at a showing.
Common mistakes
Mistake one: "List high, and if a month goes by with no offers, cut then"
The data does not support it. Among Q3 2026 single-family closings above $3 million in the three counties, reduced homes sold for a median 90.4% of original list price, and unreduced homes for 106.4% (MLSListings). Comparing within the same city and price band, homes that went pending within two weeks closed at a sale-to-original-list ratio about 11 points higher than homes on market 31–90 days, in each of the three quarters studied (Q3 2025, Q2 2026, and Q3 2026). This is correlation, and some reduced homes had condition or lot problems to begin with. But for a house with no serious flaws, listing high and cutting later means choosing to join the group that sold for less against original list and sat on the market longer. When the list prices suggested by different listing agents are far apart, how to judge whose number holds up is covered in whether to sign with the listing agent who quoted $400,000 more than the other two.
Mistake two: "The median total reduction is only 6.3%, so a cut costs me about 6%"
The reduction in list price is only part of the cost, and that 6.3% may come from more than one cut. In Q3 2026, reduced homes had a median total reduction of 6.3% from original to final list price, and once the list price came down, sellers usually gave up a little more at closing: the median sale price was 98.2% of the final list price (MLSListings). The better comparison is with homes that took no cut. Across all price points, that is 91.8% against 103.8%, a 12-point gap; in the $3M–$5M band, 91.2% against 107.3%, a 16-point gap. At 16 points, a home originally listed at $4 million works out to roughly $640,000 (illustrative arithmetic: each group is measured against its own original list price, and listing too high itself pulls the ratio down, so this is not what one cut costs a given house, and it is not a forecast).
Mistake three: "Once I cut the price, buyers will come rushing back"
The data does not support it. In Q3 2026, only 37.3% of reduced homes sold at or above their reduced list price, while 67.4% of unreduced homes sold above list; in Q3 2025 the figures were 31.3% and 63.3% (MLSListings). Among reduced homes, the longer on market, the lower the ratio: a median 93.5% of original list for those pending within 30 days, 88.5% for those beyond 90 days, with the same direction in all three quarters studied. The data has no price-cut dates and cannot tell an early cut from a late one, so this can only be read as correlation.
Mistake four: "Luxury homes rarely cut their price, so above $10 million I don't need to worry about a discount"
A low reduction share does not mean the sale price stays close to the list price. In Q3 2026, only 1 of 20 Atherton single-family closings had been reduced (5.0%), and only 7 of 41 closings above $10 million across the three counties (MLSListings; small samples, direction only). The East Atherton home above shows no list-price change on its closing record, yet sold for 88.9% of list: at this level, the discount can happen in offer negotiation. And because homes withdrawn and relisted under a new MLS number have their price-cut history reset, the reduction shares in the tables run low to begin with.
Next steps
- Before listing, price off recent sales and pendings in the same city and price band, not off a Zillow or Redfin estimate. The reasons are laid out in why Zestimate misprices the $3M+ Bay Area tier.
- Use the time between signing and going live to build interest: find interested buyers before launch, line up content and open houses, and aim for offers within the first two weeks on market.
- Make day 14 on market a review point. Count showings, second showings, inquiries from buyers' agents, and any written offers. At the same time, have the listing agent collect feedback from the buyers' agents whose clients toured on why they did not offer, then sort the objections into fixable and permanent, and fix the fixable ones first. Above $10 million, even homes with no cut spent a median 20–30 days on market (small sample; direction only), so two weeks without a contract is common there; base that review on buyer feedback, not the day count.
- Adjust the list price only once you are sure price is the problem, and base the new number on recent sales and pendings in the same city and price band. For reference, among reduced homes, those that went pending within 30 days sold for a median 93.5% of original list, and those beyond 90 days for 88.5% (MLSListings, Q3 2026; correlation only; the data has no price-cut dates).