The Short Answer
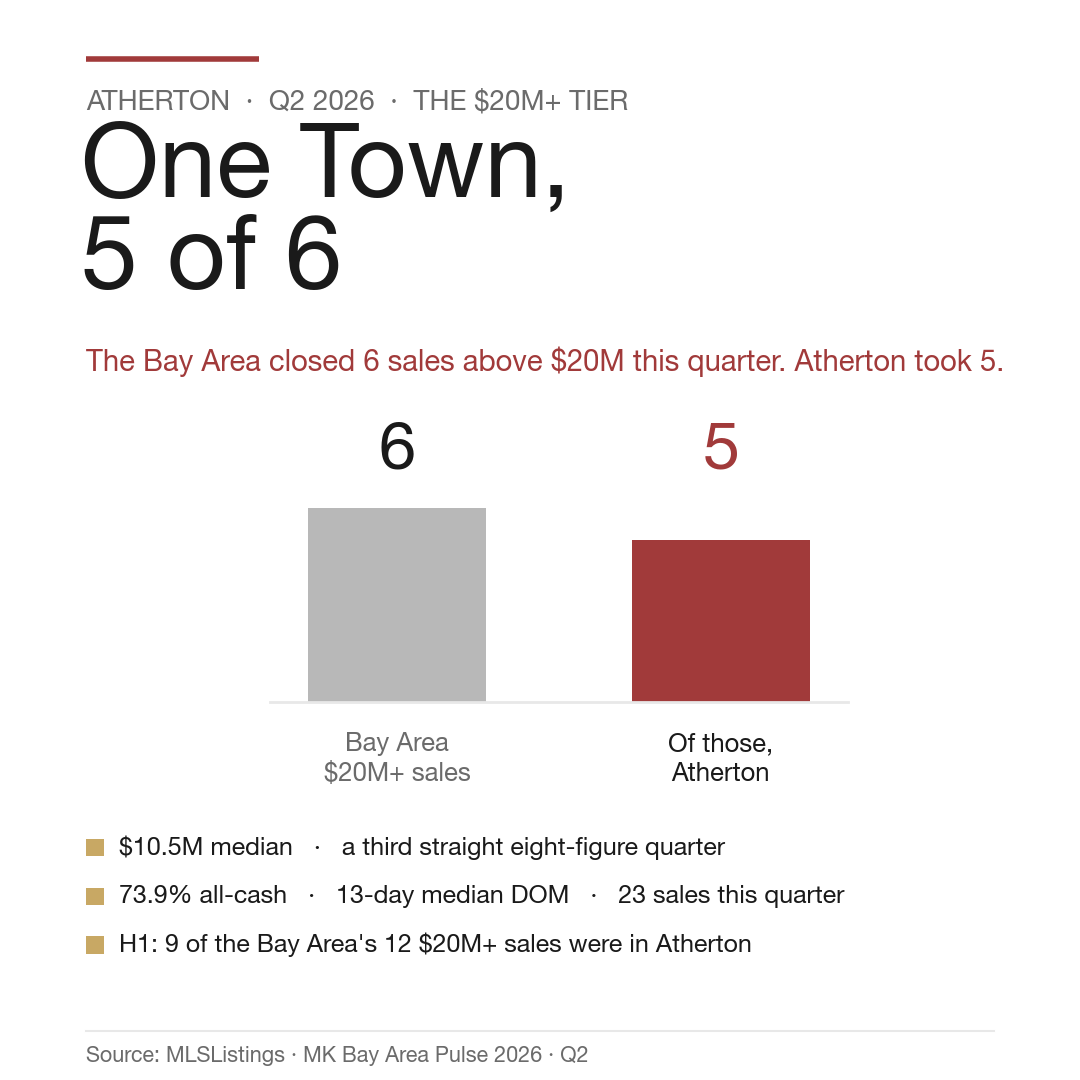
Atherton closed 23 homes in Q2 2026 at a $10.5M median, 73.9% all-cash, with a 13-day median on market — a clear step up from 17 sales a year earlier (about +35%). Of the Bay Area’s six $20M+ closings this quarter, five were in Atherton; across the first half, nine of the region’s twelve. And the median’s move from Q1’s $15.71M back to $10.5M is not a price decline — it is a change in the mix of what closed.
Who This Is For
- High-net-worth families buying or selling in Atherton in the back half of 2026 who want a quarter-level panorama with the deals named
- Cross-border family offices and wealth managers underwriting an Atherton single-asset position or running a quarterly review
- Atherton owners benchmarking their home against the actual Q2 closing set
- Trust attorneys, CPAs, and wealth advisors who need a transaction-structure factbase
- Financial reporters and researchers who want a sourced, citywide Atherton Q2 2026 report
1. The Quarter: Volume Up, Top Tier More Concentrated
The headline numbers first: 23 closings, a $10.5M median, 73.9% all-cash, a 13-day median DOM, and a 96.3% median sale-to-original-list ratio. Within the quarter, 12 sales cleared $10M and 5 cleared $20M.
Start with volume. Twenty-three is the highest count in recent quarters — 17 in Q2 2025, 18 in Q4 2025, just 10 in Q1 2026 — roughly 35% above a year ago. This is not a demand spike so much as inventory clearing: a batch of homes that had been sitting in pre-market, pocket-listing, or negotiation moved to a public close this quarter. For a town of about 2,000 homes that usually turns over single-digit to low-teens counts, 23 is a full quarter.
Then the structure. Of the 23, twelve closed above $10M and five above $20M — more than half the quarter’s volume sits in eight figures. That is what separates Atherton from the rest of the Peninsula: it is not a town with a few expensive homes; it is a town where sub-$10M is the minority. The $10.5M median is not an entry point but the midpoint of a long tail that runs from a $6M–$8M floor to a $27.75M ceiling. For why $10M+ closings decouple from mortgage rates, see the May snapshot on Atherton’s $10M median; this report fills in the full quarter.
2. The $20M+ Tier: One Town Takes 5 of the Bay Area’s 6
The headline first: the Bay Area logged six $20M+ closings in Q2 2026, and five were in Atherton 94027 — the sixth was in Palo Alto (444 Tennyson, $22.0M, financed). Across the Peninsula’s luxury towns — Hillsborough, Los Altos Hills, Woodside, Palo Alto, Atherton — 83% of the quarter’s top-tier volume closed in a single zip code. Widen the window to the full half and the region’s twelve $20M+ closings break down to nine Atherton, two Palo Alto, one Woodside — the concentration deepened through H1.
Here are the quarter’s five Atherton $20M+ closings, all all-cash:
Atherton $20M+ closings (Q2 2026, 5 total)
| Address | Sale | Original list | Days | Sale / orig. list | Payment |
|---|---|---|---|---|---|
| 77 Flood Cir | $27.75M | $34.50M | 70 | 80.4% (−19.6%) | Cash |
| 241 Polhemus | $22.75M | $25.00M | 8 | 91.0% (−9.0%) | Cash |
| 98 Flood Cir | $22.00M | $20.00M | 18 | 110.0% (+10.0%) | Cash |
| 167 Almendral | $21.90M | $24.50M | 98 | 89.4% (−10.6%) | Cash |
| 60 Ralston | $21.20M | $18.00M | 4 | 117.8% (+17.8%) | Cash |
Source: public MLSListings closing records / MK Bay Area Pulse 2026 Q2 (SFR, three counties).
What to hold onto: one street produced two of the five. On Flood Circle, both 77 Flood ($27.75M) and 98 Flood ($22.0M) closed this quarter — a measure of how estate-grade density concentrates in Atherton. All five were cash, consistent with the 73.9% citywide figure and the historic structure of the region’s $20M+ tier: at this level there is essentially no mortgage trigger, and the market behaves like a pure-equity one. The two opposite outcomes on speed and premium in that table are the subject of the next section.
3. Two Ways to Price: What a 96.3% Median Means
The citywide median sale-to-original-list ratio is 96.3% — the typical Atherton close landed about 3.7% under its original list. Against Q1’s 100.8% (the typical deal closing above list), negotiating room reopened from the bidding extreme. Note this is not the market’s first turn: Q4 2025 already closed slightly below list (99.7%); Q1’s bid-up was the outlier in that sequence.
But "below list" does not mean "discount at will." Split the $20M+ table two ways and the pricing behavior is stark:
- Priced right, gone in days and above ask: 60 Ralston closed in 4 days at 17.8% over original list; 98 Flood Cir in 18 days at 10.0% over.
- Anchored high, gave back 9%–20% to close: 77 Flood listed at $34.5M and closed at $27.75M (−19.6%) over 70 days; 167 Almendral listed at $24.5M and closed at $21.9M (−10.6%) over 98 days; 241 Polhemus closed in 8 days but at a 9.0% cut from original list.
Same zip, same $20M+ tier, same quarter: a 17.8% premium and a 19.6% discount, side by side. The lesson for both sides is that what drives speed and final price in Atherton’s top tier is how far the first cut sits from real comps — not whether the market is hot. A high-anchored seller is not unsellable; they simply pay in time (70–98 days) and in a 9%–20% concession to negotiate the price back to where the market will transact. On how $20M+ homes close below list, see why Bay Area $20M+ ultra-luxury trades below asking.
4. The Median Sequence: Why $15.71M → $10.5M Is Not a Decline
The conclusion first: Atherton’s citywide median moving from Q1’s $15.71M back to $10.5M is a change in the mix, not a luxury correction. A citywide median is the midpoint of what closed this quarter — not the price path of any one home — and in a small-sample market with a dozen-odd sales spanning $6M to nearly $28M, the median is highly sensitive to composition.
Here is Atherton’s four-quarter closing sequence:
Atherton citywide quarterly sequence (Q2 2025 – Q2 2026)
| Quarter | Closings | Median sale | All-cash |
|---|---|---|---|
| Q2 2025 | 17 | $10.70M | 58.8% |
| Q4 2025 | 18 | $10.60M | 55.6% |
| Q1 2026 | 10 | $15.71M | 80.0% |
| Q2 2026 | 23 | $10.50M | 73.9% |
Source: MLSListings citywide quarterly table / MK Bay Area Pulse (SFR, three counties).
What to hold onto: $10.5M is Atherton’s third straight eight-figure median (Q4 2025 $10.6M, Q1 2026 $15.71M, Q2 2026 $10.5M), and Q2 2025’s $10.70M was eight figures too — a median near $10M is the Atherton norm. Q1’s $15.71M is the number that needs explaining: with only 10 sales and 4 of them above $20M (40% of volume), the top tier pulled the median up. Q2 had 23 sales with $20M+ down to 5 of 23 (~22%), so the center of gravity fell back into the $10M–$15M band and the median settled at $10.5M. The top tier was actually more active this quarter (5 $20M+ vs. Q1’s 4), yet the median is lower — the cleanest illustration that the median tracks the mix, not any single home’s price. For the full structure of Q1’s ten sales, see the Atherton Q1 2026 deep report.
5. What It Means for Atherton Buyers and Sellers
Sellers: back to pricing realism
The two highest sales of the quarter (77 Flood at $27.75M, 167 Almendral at $21.9M) both closed 10%–20% under original list and took 70–98 days. A 96.3% median sale-to-list says the list price is a starting point for negotiation, not a floor. Anchor to the last 90 days of real comps, not to active listings or a neighbor’s ambition from last year. The cost of pricing high is not being unsellable — it is grinding the price back down over time and a final concession, while public days-on-market accumulate and weaken your later negotiating position.
Buyers: the window reopened, but the right house still goes fast
Relative to Q1’s bid-to-list frenzy, Q2 genuinely reopened negotiating room — the typical close is back below original list. But 60 Ralston (4 days, +17.8%) and 98 Flood (18 days, +10.0%) are the reminder: a well-priced, well-built home does not wait for you. Sort candidates into "move fast" and "can negotiate" — the first needs proof of funds and an execution plan ready in advance; the second needs your own read on comps. Cross-border and family-office buyers should settle the holding structure (individual / LLC / trust) and the closing timeline before the LOI. For the citywide and sub-community buyer framework, see buying in Atherton.
An MK Group Field Note
The data describes an outcome distribution; on the ground, many deals close before they ever reach public data. In one Atherton off-market purchase where MK Group founders Marie Wang and Kevin Mo represented the buyer, the home — roughly $18M, built to an owner-architect’s own standard over four years — held most of its value where you cannot see it: a full basement equipment room with dedicated heat planning, wiring run in-wall with pre-provisioned rooms, independent door-entry and monitoring on all three floors, and lighting, security, and irrigation tied into one system, with two full boxes of manuals preserved. The buy-side agent’s core job was translating that hidden systems value for the buyer.
Notably, this buyer could have paid cash but chose to finance about $10M — and faced all-cash rivals. The offer was not the highest, yet the seller chose it, on the strength of fit plus an execution plan that hedged the 30–35 day loan and two appraisals with transparent communication and contingencies. That is the same logic as the quarter’s $20M+ split: at Atherton’s top, fit and execution certainty often beat a bigger number. (Anonymized; the funding structure, timeline, and the architect-built / off-market / not-highest-offer facts come from MK Group’s public record of one real transaction.)
Worth flagging: off-market closings like this never enter MLS data. As an industry observation, Atherton’s top tier moves a meaningful share of homes through pre-market, pocket listings, and relationship networks beyond public sales — which is why Atherton buyers often feel there is "nothing to buy" while real liquidity is higher than the public numbers suggest. On how the off-market channel works, see off-market listings in the Bay Area.
Four Common Misconceptions
Atherton’s median fell from $15.7M to $10.5M — are luxury prices dropping?
No — that is a change in the mix, not a decline. Q1 had 10 sales, 4 above $20M, pulling the median to $15.71M; Q2 had 23 sales with $20M+ down to 5 of 23, so the center shifted back and the median landed at $10.5M. The top tier was actually more active this quarter (5 vs. 4), yet the median is lower. A citywide median is the midpoint of the mix, not any single home’s price path. Read price direction from like-for-like comps, not the quarter-to-quarter swing of a citywide median.
Are $20M+ homes effectively sure sales at whatever they list for?
No. In the same quarter and tier, 60 Ralston closed in 4 days at 17.8% over list, while 77 Flood took 70 days and cut 19.6%, and 167 Almendral took 98 days and cut 10.6%. Priced right, it goes that week; priced high, it waits three months and still concedes 10%–20%. The top tier has very little tolerance for mispricing. "Sure sale" belongs only to the seller whose first cut is aligned to real comps.
With a 96.3% median sale-to-list, can I just lowball everything?
Separate "typical" from "every home." The 96.3% is a citywide median — it says the list price is a starting point with roughly 3.7% of downside on average — but that median is pulled out by high-anchored homes conceding 9%–20% alongside others clearing at 10%–17.8% over ask. Lowball a well-priced quality home and it usually goes to another buyer at a premium. Your room depends on how far this home’s list sits from real comps, not on a fixed discount you can apply citywide.
Atherton’s cash share slipped from 80% to 73.9% — is luxury leaning on loans now?
No. Year over year it actually rose: Atherton’s cash share was 58.8% in Q2 2025 against 73.9% this quarter, and Q1’s 80% was the outlier — 8 of just 10 small-sample sales. 73.9% is still among the highest in the Bay Area, and all five $20M+ closings this quarter were cash. When financing does appear at the top, it is usually opportunistic, not dependent: with equities up about 20% over a year, selling stock to pay all-cash forfeits a compounding position and triggers current capital-gains tax; when a mortgage or securities-backed line costs less than the portfolio’s expected return, financing is an optimization, not an "I can’t afford it." Judge top-tier leverage by whether it is a default trigger — in Atherton, that trigger essentially does not exist. ⚠️ On tax and financing structure, confirm your own situation with a CPA or tax attorney.
Next Steps
- Place Atherton in the regional frame: compare it with Palo Alto, Hillsborough, and Woodside on the same dimensions (volume, median, DOM, cash share) in MK Bay Area Pulse 2026 Q2.
- For a Q1→Q2 review, read this alongside the Atherton Q1 2026 deep report to see how top-tier concentration and the median’s composition effect moved across two quarters.
- Sellers: anchor the first cut to the last 90 days of real comps (not active listings), and pre-set an adjustment path for "if no competitive offer in two weeks" to avoid stacking public days-on-market.
- Buyers: sort candidates into "move fast" and "can negotiate" — have proof of funds and an execution plan ready for the first; build your own comp read for the second. Sub-community and street framework: buying in Atherton.
- Cross-border / family-office / trust buyers: settle proof of funds, AML documentation, and the holding structure (individual / LLC / trust) before the LOI, and confirm closing and holding tax with a CPA or tax attorney.
Related Reading
⚠️ This report is market information and decision education, not tax, legal, or investment advice. For execution involving holding structure, cross-border funds, or financing/tax, confirm your own situation with a CPA, tax attorney, or licensed advisor. Figures reflect a specific time window and may change with later revisions.