The Short Answer
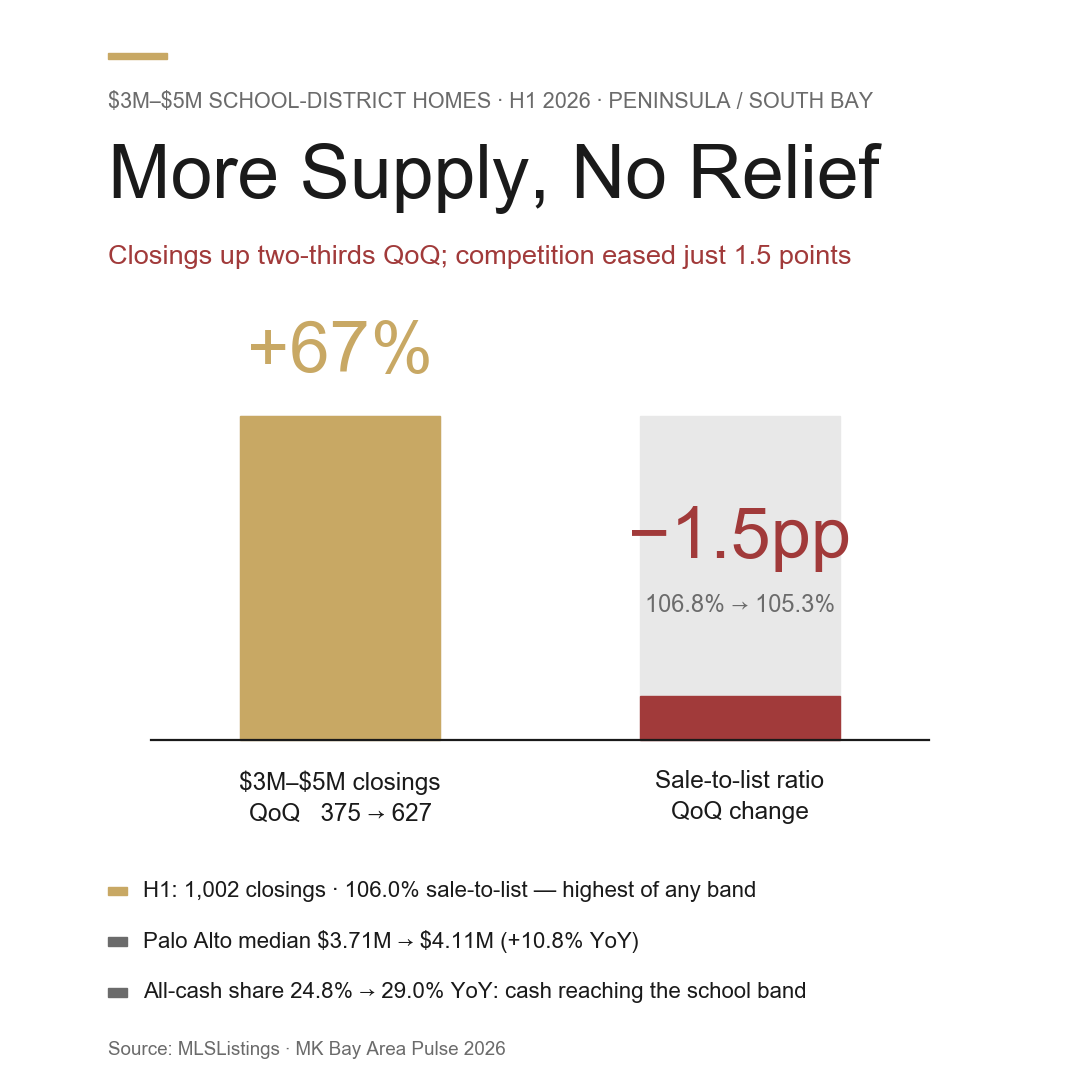
Because supply grew and demand grew with it. In Q2 2026 Bay Area $3M–$5M school-district closings jumped 67% QoQ (375→627), yet the sale-to-list ratio eased only from 106.8% to 105.3% — more listings, almost no relief. Across H1 the band cleared 1,002 homes at a 106.0% sale-to-list ratio, the tightest of any price tier.
Who This Is For
- Dual-income tech families with a $3M–$5M budget for whom a specific attendance area is non-negotiable
- Buyers weighing "enter this year or wait one more" who want the cost of waiting in dollars
- Households willing to trade Palo Alto / Los Altos for the calmer bidding of Cupertino / Saratoga
- Readers who want the structural reason more supply did not loosen the market
Why the Supply Surge Brought No Relief: A Real Supply-Shock Test
We have written before on why $3M–$5M school-district homes are harder to buy than $10M+ estates — the band concentrates the largest dual-income buyer pool against the most rigid attendance-area supply (see the Q1 competition-density piece). The first half of 2026 offered a rare natural experiment: if supply suddenly grew by two-thirds, would the crush ease?
It barely did. Quarterly closings in the band went from 375 in Q1 to 627 in Q2 — up 67% — while the sale-to-list ratio fell only from 106.8% to 105.3%, a 1.5-point move. More supply, no cooling.
The headline numbers first: across H1 the $3M–$5M band cleared 1,002 homes at a 106.0% sale-to-list ratio — the highest of any price tier — with an all-cash share steady near 29% and a median of just 8 days on market.
| Metric | Q1 2026 | Q2 2026 | H1 2026 |
|---|---|---|---|
| Closings | 375 | 627 | 1,002 |
| Sale-to-list ratio | 106.8% | 105.3% | 106.0% |
| All-cash share | 29.1% | 29.0% | 29.0% |
| Median days on market | 8 | 8 | 8 |
| Source: MLSListings (SFR closings, three counties) · MK Bay Area Pulse 2026-Q2 / H1 | |||
What to remember: even with supply up 67% QoQ, the band still cleared at 5%+ over asking, in 8 days, nearly a third all-cash. By contrast the $10M+ top end sat 24 to 44 days on market and often closed below asking ($10M–$20M at 95.9%, $20M+ at 90.2%) — the top can negotiate; the school band cannot. The tension at $3M–$5M is structural, not a passing mood.
Why Demand Grew Alongside Supply
If supply rose and competition held, demand had to be expanding too — and the driver is the balance sheet. The S&P 500 rose roughly 20.9% over the year (about 7,499 at quarter-end), which directly lifts the down-payment power of dual-income tech families whose deposits are largely RSUs, options and appreciated equity. A year of gains means a bigger check.
Cash penetration makes the point sharper: the band all-cash share rose from 24.8% to 29.0% YoY, against a market-wide average of just 20.4%. The all-cash playbook once concentrated at the $10M+ top is descending into the school tier (for the mechanism, see the luxury cash-decoupling piece). For a mortgage buyer, that means competing head-on with a growing share of cash offers even at this "entry" school level.
The Cost of Waiting Is Now Measurable
The number worth remembering is what one more year of waiting costs. Palo Alto median closing price rose from $3.71M in Q2 2025 to $4.11M in Q2 2026 — up 10.8% YoY. Enter a year later and a comparable home costs roughly $400K more at the median.
This is a shift in the whole median, not a single outlier. For families funding down payments with cash or stock, that $400K often means selling more of a still-compounding position. In this band, the opportunity cost of "waiting for rates to fall" carries a price tag you can read directly.
Where the Bidding Is Calmer: Five School Cities
The headline first: among the strong school cities, Palo Alto (105.5%) and Los Altos (105.4%) both clear above 105% — routinely 5%+ over asking — while Saratoga sits at just 100.1% (essentially at list) and Cupertino at 104.4%. Still competitive, but not the same intensity.
| School city | Q2 closings | Median price | Sale-to-list | Median DOM | All-cash share |
|---|---|---|---|---|---|
| Palo Alto | 110 | $4.11M | 105.5% | 9 | 40.0% |
| Los Altos | 80 | $4.86M | 105.4% | 8 | 32.5% |
| Menlo Park | 72 | $3.87M | 102.6% | 9 | 36.1% |
| Saratoga | 56 | $4.23M | 100.1% | 10 | 33.9% |
| Cupertino | 41 | $3.35M | 104.4% | 8 | 22.0% |
| Source: MLSListings (SFR closings, three counties, 2026-Q2) · MK Bay Area Pulse | |||||
What to remember: if your attendance area can flex, Cupertino (lowest median at $3.35M) and Saratoga (clearing at list) are the rational entry points — bidding near or at asking rather than starting 5% over just to make the first rounds. Palo Alto is the other extreme, with an all-cash share of 40.0%, the highest of the strong school cities, where mortgage buyers face the most pressure. The spread between sub-markets is far wider than a single "$3M–$5M" label suggests.
What Would Actually Cool This Band
Unpack the Q2 surge and the outlook is sober. A large share of those 627 closings was the seasonal spring listing wave (Q1 is the quiet winter season, Q2 the peak), not a structural shift in supply — and even that flood could not push the sale-to-list ratio down two points. The supply that would actually keep growing comes from move-up owners willing to sell and rebuy — but most are locked into 2%–3% pandemic-era mortgages, and trading into today's 6.41% means a much larger monthly payment, so they stay put. The result: the steady sellers in this band are non-replacement ones — estates, cross-state and cross-border relocations, divorce, out-of-area rebalancing. Attendance-area supply is fixed by geography while the buyer pool keeps refilling from tech wealth. Put those together and there is no near-term structural switch that cools the $3M–$5M school band.
What We See on the Ground
MK Group works with buyers in this band daily, and the profile is remarkably consistent: dual-income tech families, one or both partners in engineering or research at a major company, healthy cash flow but not yet financially independent. Their search radius is rarely "which city is the best value" — it is "which attendance area is the floor." Education, not the commute, is the deciding variable in both the move and the offer.
A representative case: a dual-income couple doing AI research at a Seattle employer relocated to the Bay Area for their eight-year-old's long-term education path, and chose a home inside Palo Alto Unified rather than a step up into Atherton — because they were still working, wanted a public-school floor, and valued being within walking or biking distance of Stanford. These education-driven buyers look at different homes, ask different questions and close on different logic than the $10M+ asset buyer.
What Marie Wang and Kevin Mo see repeatedly here is that a structurally clean offer — tidy terms, a fast close, a flexible rent-back — wins more homes than a marginally higher price. In a band with a median of 8 days on market and a 106% sale-to-list ratio, sellers want certainty. It is why simply "paying more" so often fails: what you are winning is term cleanliness, not a bigger number.
Common Misconceptions
Misconception 1: "Supply is up — wait for inventory to pile higher and I'll find a deal"
Supply in the band already rose 67% QoQ while the sale-to-list ratio moved only from 106.8% to 105.3%. And that surge was mainly seasonal — Q1 is the quiet winter season, Q2 the spring peak, so listings were always going to climb. The catch is that demand refilled in step: more homes, a bigger buyer pool, no real inventory buildup. "Wait for inventory, then bargain" has not paid off in this band for two quarters.
Misconception 2: "School-district homes always appreciate — buying now or later is the same"
The cost of waiting now converts straight into dollars. Palo Alto median rose from $3.71M to $4.11M in a year, up 10.8% — enter a year later and a comparable home costs roughly $400K more at the median. "It's all the same" ignores an entry threshold that compounds; for families funding with cash or stock, that gap often equals selling more of a still-compounding position.
Misconception 3: "Offering list price locks it up"
Among the five main school cities, Palo Alto and Los Altos both clear above 105% — routinely 5%+ over asking — so a list-price offer there often does not survive the first rounds. Only Saratoga (100.1%) clears near list, with Cupertino (104.4%) more moderate. Bid strategy has to be set per sub-market; one "list price" anchor does not travel across cities.
Misconception 4: "Once rates fall, this band eases"
The direction may be the opposite. Most incumbent owners are locked into 2%–3% rates; falling rates would coax some to move up and release replacement supply, but they would also amplify buyer purchasing power — supply and demand loosen together. The real structural bottleneck is not rates but attendance-area supply fixed by geography plus a scarcity of willing move-up sellers. Honestly, there is no near-term switch that relieves this band.
Next Steps
- Fix the non-negotiable attendance line first — a whole district as a floor, or one specific elementary boundary. That sets your search radius, your premium ceiling, and whether calmer neighboring cities belong on the list.
- Treat offer structure as your first lever, not price — in a band that clears in 8 days, clean terms, a fast close and a flexible rent-back often move a seller more than another $30K. Line them up with your lender and attorney before you bid.
- Use the city comparison to pick your entry point — if the attendance area can flex, Cupertino (104.4% sale-to-list) and Saratoga (100.1%) clear closer to asking than Palo Alto or Los Altos at 105%+.
- Put the cost of waiting into your budget — use Palo Alto's +10.8% year to gauge what one more year adds to a comparable home before you decide to watch or act.
- Read the segment data with the competition mechanism — pair the price-band figures in MK Bay Area Pulse 2026 Q2 with the school-district budget tiers to judge your own sub-market's real intensity.
Related Reading
- MK Bay Area Pulse 2026 Q2: closing structure and city data across price bands
- Why $3M–$5M school-district homes are harder than $10M+ estates: Q1 2026 competition density
- Bay Area housing market: the H1 2026 review
- Bay Area school-district budget tiers: which districts each price buys
- Luxury cash decoupling: equities and all-cash Bay Area purchases