Quick Answer
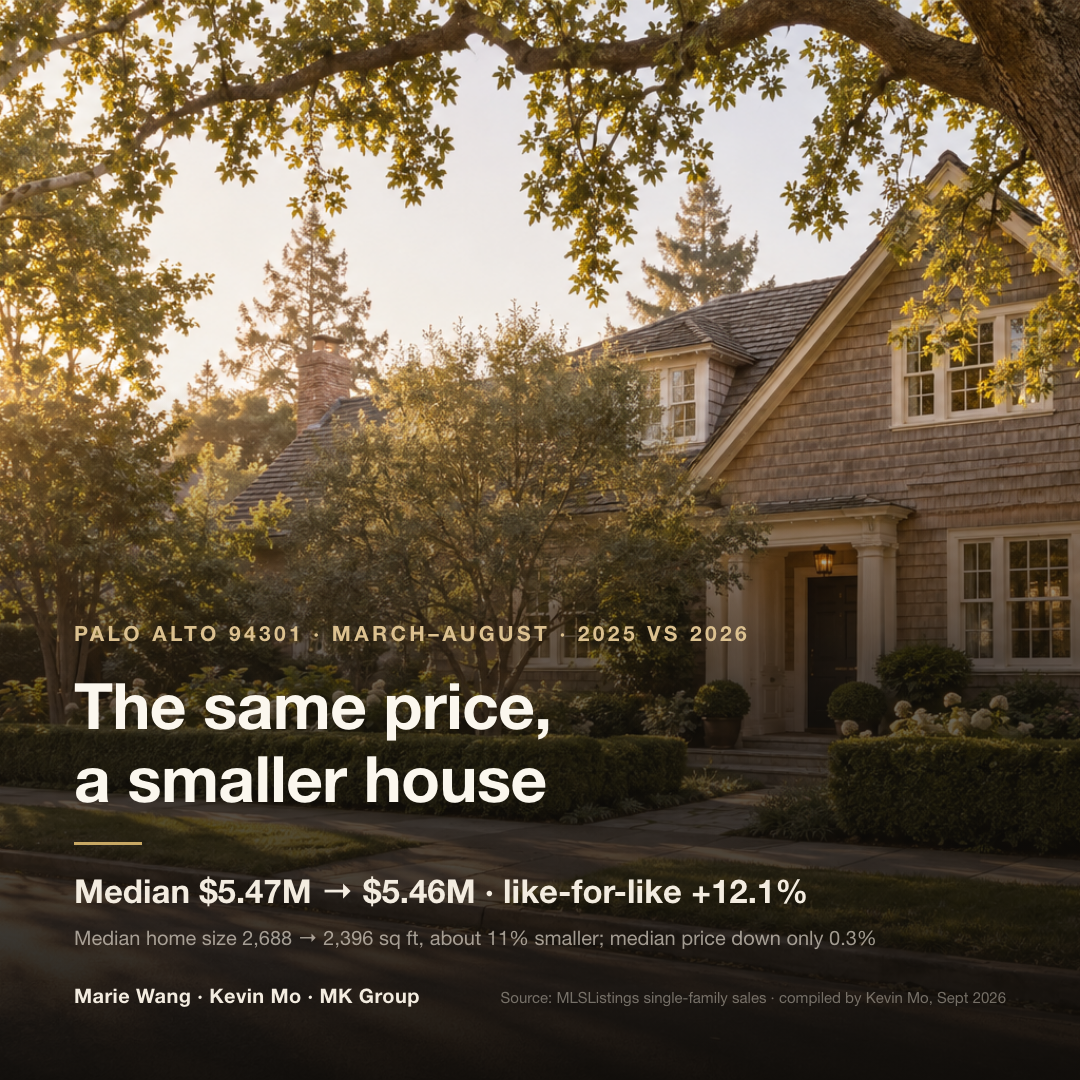
Probably not the same house — most likely a smaller one. In Palo Alto's 94301 ZIP code, the median single-family sale price went from $5.47M to $5.46M in a year, a 0.3% dip. Yet with size, lot and age held constant, the same house cost 12.1% more. This year, the increase shows up as a smaller house.
The figures come from a September 2026 market-analysis video by Kevin Mo, co-founder of MK Group (YouTube @KevinMoRE, 24K+ subscribers). Using MLSListings single-family closed sales, he compared two exactly matching windows: March–August 2025 (441 sales) and March–August 2026 (369 sales), across Palo Alto and Menlo Park — 810 sales in all, with condos and townhomes excluded. Pool those 810 sales and hold four variables constant — size, lot, age and ZIP code — and a comparable home this year is estimated to cost about 12% more than last year. That is a statistical estimate with a range: 8.4% at the most conservative, 15.7% at the high end. The check hasn't changed. What that check buys has.
Who this article is for
- Buyers who toured homes in Palo Alto or Menlo Park last year with a budget between $5M and $9M, and are getting ready to try again this year
- Buyers who have read a quarterly report or a price-band median, concluded the market "hasn't really moved," and assume last year's budget still works
- Families focused on 94301 — Old Palo Alto, Professorville, Crescent Park — who want to know how much house this money buys now
- Buyers whose budget is capped and who need to decide, before they start, what they can give up and what they can't
Three core dimensions
A fixed budget buying a smaller house is almost invisible in the usual market reports. Three questions bring it into view: where the price increase is hiding, how much of the budget competitive bidding takes, and — once the budget is capped — what to give up first.
Dimension one: measure the market by what the same money buys, not by a price-band median
Kevin's method is to put two houses side by side: same size, same lot, similar age, same ZIP code. The only difference is that one sold in 2025 and the other in 2026. Once those four variables are held constant statistically, this year's house is estimated to cost about 12% more. A like-for-like comparison of this kind comes far closer than a median to the question buyers actually care about.
So why don't most market reports show it? Because the measure they lean on most is the median sale price within a price band — and the homes sold this year were never the same homes sold last year. Kevin offers a hypothetical in the video. Take a reporting band of $7M–$12M. A house that sold for $6.8M last year and is worth $7.6M this year moves into the band. A house that sold for $11.5M last year and is worth $12.5M this year moves out of it. What enters is a house that used to sit a tier lower; what leaves is the most expensive group. Even when real prices have clearly moved up, the band's median can look unchanged. For a buyer, then, the useful question isn't "how much did this price band go up?" It is "what did my budget buy last year, and what does the same money buy this year?"
Dimension two: budget for what you'll bid over list
Size is only the first change. In the sales data the video presents for the same periods, the median ratio of sale price to original list price rose from 1.011 to 1.055: the typical home went from closing about 1.1% above its original list price to about 5.5% above. The share of homes selling above original list rose from 57% to 68% — out of every 100 sales, from 57 to 68. As rough math at those median ratios, a home listed at $5M would typically have closed about $55,000 over list last year, and about $275,000 over list this year. Days on market barely moved; the median went from 10 days to 9. This year's buyers are getting smaller houses, and more often have to go above list to win them.
Dimension three: with a capped budget, rank first — then decide whether to add money
Faced with shrinking purchasing power, Kevin's view is that buyers aren't limited to raising their budget again and again. More important than adding money is getting the order of trade-offs clear. He generally suggests sorting needs into three groups:
- Non-negotiables: commute distance, number of bedrooms, or — with an older parent in the household — a bedroom on the ground floor
- Things money can fix: the level of finish, landscaping, and some interior features
- Things renovation can almost never change: lot size, the street, noise, topography, and the basic scale of the house itself
Once the budget is fixed, the real work is ranking. If location, land, size and condition are all non-negotiable, the only thing left to move is the budget. In I Have $4M–$6M for a House in Palo Alto. What Does That Actually Buy?, Marie Wang works through a "can change / can't change" list using real listings, so it isn't repeated here. One point matters for this article: the same money buys a smaller house this year, and your ranking decides which part you give up.
The numbers: in 94301, a flat median and a noticeably smaller house
Key numbers first: in north Palo Alto's 94301 ZIP code — Old Palo Alto, Professorville and Crescent Park — the median single-family sale price was $5.47M in March–August 2025 and $5.46M over the same months of 2026, down 0.3%. Over the same period, the median size of homes sold fell from 2,688 to 2,396 square feet, a drop of 292 square feet, or about 11%. With size, lot and age held constant, a comparable home in 94301 cost 12.1% more. That result rests on 170 sales, not a handful of houses.
| Metric | March–August 2025 | March–August 2026 | Change |
|---|---|---|---|
| 94301 median single-family sale price | $5,470,000 | $5,460,000 | −0.3% |
| 94301 median living area of homes sold | 2,688 sq ft | 2,396 sq ft | −292 sq ft (about −11%) |
| 94301 like-for-like price (size, lot, age held constant; 170 sales) | Baseline | — | +12.1% |
| Palo Alto + Menlo Park single-family sales | 441 | 369 | 810 combined |
| Two-city like-for-like price (size, lot, age, ZIP code held constant) | Baseline | — | About +12% (range 8.4%–15.7%) |
| Sale price / original list price (median) | 1.011 | 1.055 | About 1.1% over list → about 5.5% |
| Share sold above original list price | 57% | 68% | +11 percentage points |
| Median days on market | 10 days | 9 days | Essentially flat |
Scope: MLSListings single-family closed sales (condos and townhomes excluded), Palo Alto and Menlo Park, March–August 2025 versus March–August 2026. Figures come from the analysis in Kevin Mo's September 27, 2026 video; this article restates them and has not re-run the numbers. The like-for-like increases are model estimates holding size, lot, age and ZIP code constant; the two-city estimate pools four ZIP codes. ZIP 94303 straddles Palo Alto and East Palo Alto; the video set it aside as unrepresentative. The three bidding measures (sale-to-original-list ratio, share sold above list, days on market) are the video's figures for the same periods; the video does not specify whether they cover all sales or 94301 alone. The size difference is the gap between the two period medians.
What to remember: a flat median and a 12% like-for-like increase don't contradict each other. Kevin's reading is that some of 94301's larger, newer homes have already moved out of the low-$5M range. The homes still selling at that price are more often a little smaller, or a little older. The missing 300 or so square feet, in daily life, might be a full bedroom and a bathroom — or a living room, or a large separate study. If your reference point in 94301 last year was "about $5M, about 2,700 square feet," the same budget this year is more likely to show you about 2,400 square feet — and more often you'll have to go above list to get it.
Key numbers first: narrow the view to Palo Alto single-family homes between $7M and $8M, and there were only 10 sales last year and 10 this year. Across those 10, the median living area fell from 3,934 to 3,492 square feet, down 442 square feet or about 11.2%. The median lot fell from 9,350 to 7,545 square feet, down 1,805 square feet or about 19.3%.
| Palo Alto single-family, $7M–$8M | Last year | This year | Change |
|---|---|---|---|
| Sales | 10 | 10 | — |
| Median living area of homes sold | 3,934 sq ft | 3,492 sq ft | −442 sq ft (about −11.2%) |
| Median lot | 9,350 sq ft | 7,545 sq ft | −1,805 sq ft (about −19.3%) |
Scope: Palo Alto single-family sales between $7M and $8M, described in the video as "last year" and "this year," with 10 sales in each. The sample is very small — one or two unusual homes are enough to move the median — so treat it as directional, not as a market rule. Changes are calculated between the two period medians.
What to remember: the direction matches 94301. The same money bought a house about 11% smaller, on a lot about 19% smaller. Kevin puts the limitation up front in the video: 10 sales a year isn't enough to establish a market rule. He shares the numbers anyway because this is the price point many buyers care about most. Read them as a direction, not a price sheet.
What MK Group sees on the ground
The three points below come from Kevin Mo's reading of this data in the video and the general advice he gives buyers. They are not a review of any single transaction.
The shoes at the open-house door say more than the model
Kevin finds the move in the sale-to-list ratio from 1.011 to 1.055, and in the share of homes selling above list from 57% to 68%, easier to grasp than the statistical model — because it is exactly what buyers feel in person. Walk into an open house and there are plenty of people touring, and plenty of shoes lined up at the door. Days on market only went from 10 to 9, so the pace doesn't look strained. The strain shows up in the offers: on the same house, more buyers are willing to go above list.
What $8M realistically buys in Palo Alto
Based on the 10 sales a year between $7M and $8M, Kevin's realistic expectation is this: shopping in Palo Alto with $8M today, you are looking at 3,500–3,800 square feet on a standard city lot of around 7,500 square feet, and the house probably won't be especially new. If you insist on something close to 4,000 square feet, or a newer house in better condition, or a more central location on top of that, the budget will most likely need to move to $9M or more. He chooses those words deliberately: "I say 'most likely' because it's a direction I'm reading from a dozen or so sales. It isn't a rule." (Translated from Mandarin.) When it comes time to make an offer, the real budget depends on where that particular house sits.
Accept an older kitchen for a better street and more land
Among the three groups of needs, the trade-off Kevin favors is to give ground on the things money can fix and hold firm on the things renovation can't change. If you're willing to accept an older kitchen in exchange for a better street and more land, he often sees that as the better deal. A kitchen can be redone later; the street and the land are fixed the day you buy. The market won't make this decision for you, but the earlier you settle it, the more clearly you'll know whether to move when the right house appears. If your budget is closer to $10M and you're still weighing land against location across two cities, see I Have $10 Million — Should I Buy in Atherton or Palo Alto?
Common Misconceptions
Misconception 1: "The 94301 median barely moved in a year, so prices in north Palo Alto haven't gone up"
A median tells you what price range this year's sales landed in; it doesn't tell you how much the price of the same kind of house changed. The 94301 median single-family price went from $5.47M to $5.46M, down 0.3%. But the median size of homes sold over the same period fell from 2,688 to 2,396 square feet, and with size, lot and age held constant, a comparable home cost 12.1% more. Some of last year's larger, newer houses have priced their way out of that range. The median stayed put; the house got smaller.
Misconception 2: "The report says this price band's median hasn't changed, so my budget still works"
A price-band median gets diluted by homes moving in and out of the band. Take a $7M–$12M band (the video's hypothetical): a house that sold for $6.8M last year rises to $7.6M and enters the band; a house that sold for $11.5M rises to $12.5M and leaves it. Real prices move up while the band's median may not budge. To judge whether a budget is enough, compare last year's and this year's sales with similar size, lot, age and ZIP code — not a price band's median.
Misconception 3: "Days on market haven't gotten longer, so competition must be easing"
In the video's figures for the same periods, median days on market went from 10 to 9 — essentially flat. But the median ratio of sale price to original list price rose from 1.011 to 1.055, and the share of homes selling above original list rose from 57% to 68%. The competition didn't show up in the pace; it showed up in the price. As rough math at the median ratio, a home listed at $5M would typically close about $275,000 over list this year, against about $55,000 last year. When you estimate your total budget, don't assume you'll buy at list.
Misconception 4: "$8M in Palo Alto only buys 3,500 square feet — that's settled"
Palo Alto single-family homes between $7M and $8M had only 10 sales last year and 10 this year. The median size fell from 3,934 to 3,492 square feet and the median lot from 9,350 to 7,545 square feet — the same direction as 94301. But 10 sales a year doesn't make a rule, and one or two unusual houses can move the median a long way. Kevin's 3,500–3,800 square feet is a realistic expectation, not a verdict. Which house, and where it sits, is what sets the real budget.
Misconception 5: "If I can't get the house I want, the only answer is a bigger budget"
Adding money is the last step, not the first. Start by sorting needs into three groups: non-negotiables (commute, bedroom count, a ground-floor bedroom for an older parent), things money can fix (finishes, landscaping, some interior features), and things renovation can't change (land, street, noise, topography, the basic scale of the house). Only when location, land, size and condition are all fixed does the budget come into play. Conversely, accepting an older kitchen in exchange for a better street and more land is often the better trade.
Next steps
- Translate last year's budget into size, lot and condition. Don't just remember "$5M." Write down what $5M bought — roughly how many square feet, how much land, what condition — then line it up item by item against this year's sales in the same ZIP code and price range to see where the gap is.
- Judge the market with like-for-like sales. When you pull comps, compare two years of sales in the same ZIP code with similar size, lot and age. Don't draw conclusions from a price-band median.
- Build the over-list margin into your budget ceiling. In the video's figures for this year, the median sale closed at about 1.055 times original list price, and nearly 70% of sales closed above original list. Work backward from the list price and the budget may well fall short the moment you make an offer.
- Write your needs in three columns, and give ground only in the second. Non-negotiables, things money can fix, things renovation can't change. Hold firm first on land, street, noise, topography and the basic scale of the house.
- If you're torn between $8M and $9M, first work out what the extra $1M buys. Compare, item by item, whether the additional money goes to size, land or condition — then decide whether to stretch.