Direct answer
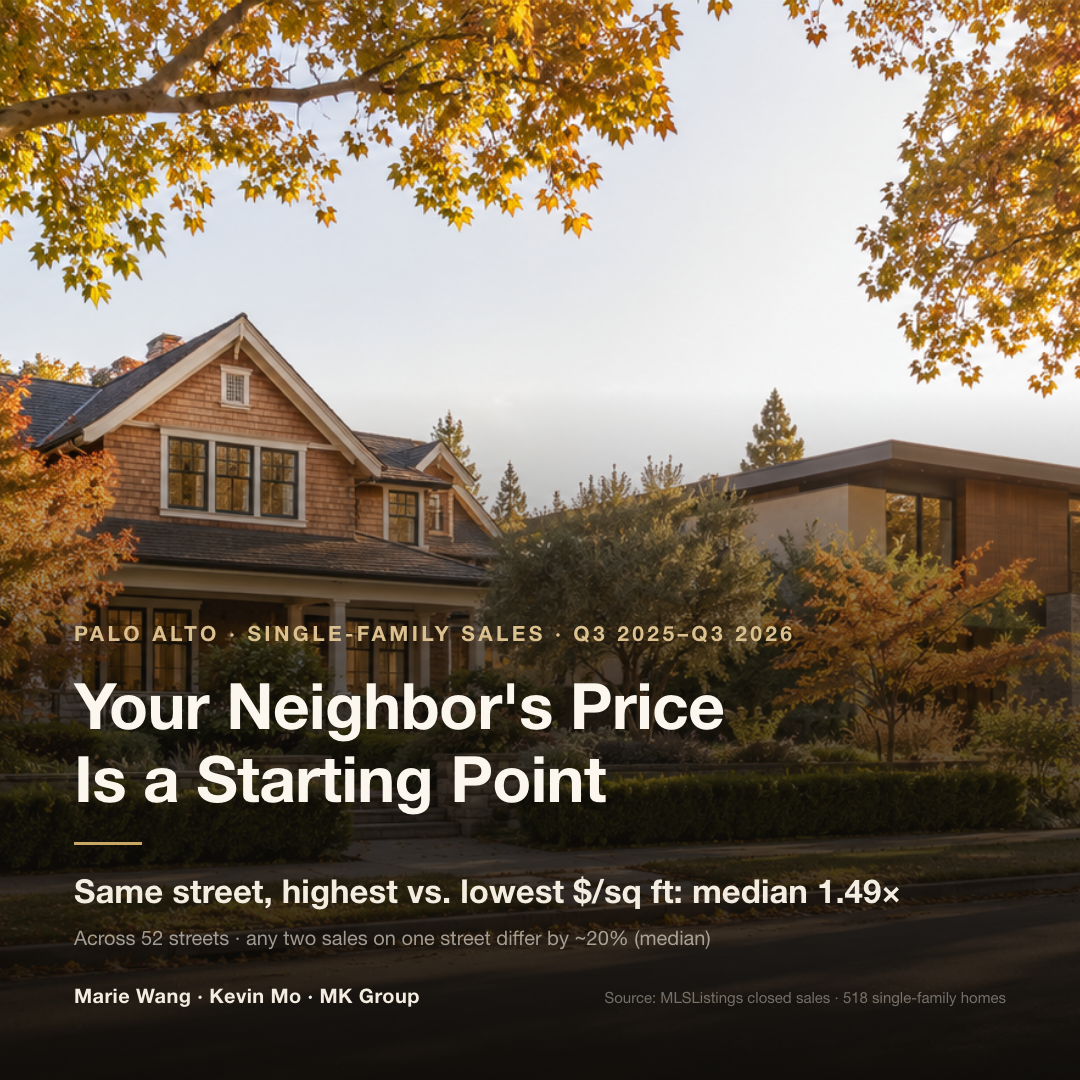
Not as it stands. Your neighbor's $10M is a starting point. In MLSListings Palo Alto single-family sales from Q3 2025 through Q3 2026, the highest and lowest price per square foot on the same street sit a median of about 1.49× apart, and any two sales on one street differ by a median of about 20%.
Two houses of similar size still pull apart on price per foot. Lot size and shape matter. So do age and whether the house is move-in ready, how the basement is counted, and whether it fronts a busy road. Then there is timing: which month the neighbor closed, and how many days it took to go into contract. The right way to use that sale is to break it down into an adjustable comp. First confirm whether the number is a sale price or a list price. Then adjust for each difference between the two homes. Finally, test the result against your sub-area's price-per-foot range and see whether it holds.
Who this article is for
- Palo Alto single-family owners who have just watched a house on their street, or next door, close at a strong price and are now wondering what theirs could list for — particularly homes above $5M in and around Old Palo Alto, Crescent Park, Community Center and Professorville
- Owners planning to sell within the next 6–12 months who want to take the nearby sales apart themselves before sitting down with a listing agent to talk price, including owners based overseas who are working mainly from records available online
- Owners whose homes stand out in lot, age or location — a large lot, a narrow lot, a basement, a position near a main road — and who worry that borrowing the neighbor's number will set their price too high or too low
Three questions that decide what the neighbor's sale is worth to you
Pricing your home off a neighbor's sale means clearing three checks: whether that sale is usable at all, where the two houses differ, and how wide the price spread already is inside your sub-area. The figures below come from MLSListings Palo Alto single-family sales with close dates from July 1, 2025 through September 30, 2026 — 518 sales after de-duplicating by address, sale price and city. "Price per square foot" means sale price divided by the MLS living-area field, and "sub-area" means the MLS Area designation.
Question one: the neighbor's sale itself — sale price or list price, when it closed, how long it sat
Start by confirming what the $10M you heard actually is. A list price is what the seller asked. A sale price is what a buyer paid. At the top of the market the two often diverge: over five quarters, the 42 Palo Alto sales above $8M closed at a median of only 97.5% of original list price, and about six in ten sold below it.
Next, look at when it closed. In a rough model that controls for sub-area, living area, lot size and building age, Palo Alto single-family homes in Q3 2026 ran about 10% above Q3 2025. The raw citywide median price per square foot, same quarter year over year, rose from $1,974 to $2,188. A neighbor's sale from a year ago needs adjusting upward; one from a few weeks ago barely does. Finally, look at days on market. Across the five quarters, homes that went into contract within two weeks closed at a median 109.1% of original list price; homes on market 31 days or more closed at 91.6%. If your neighbor drew several offers in the first week, part of that price per foot is a bidding premium from that moment, and it may not repeat for you.
Question two: where the two houses differ — living area, lot, condition, basement, road frontage
Similar square footage does not mean similar price per foot. Within the same sub-area, homes larger than the sub-area median sell for about 0.83× the price per foot of the smaller half: the bigger the house, the cheaper each additional foot. Lot size runs the other way. In the model, a 10% larger lot adds about 2.6% to total price. In Old Palo Alto, where land is most expensive, the half of sales with lots above the sub-area median carried about 21% more per square foot (22 against 23 sales — a small sample, so read the direction only). Age has a more direct effect: holding sub-area, living area and lot constant, homes built in 2000 or later sold for about 12% more. Age here is only a proxy for move-in ready. A renovated older home still counts as older in the data.
Lot shape, basements and road frontage cannot be quantified from this data, yet each can move price per foot. Basements need a common definition first. MLS living area is entered by the listing side, and some listings include the basement while others do not. Palo Alto's calculation of single-family floor area generally excludes a basement that meets height conditions (Palo Alto Municipal Code Title 18, definition of floor area). So two homes both listed at 5,000 sq ft may be very different houses: one with 5,000 sq ft above grade, the other with 3,500 above and 1,500 below. Road frontage is a discount you cannot renovate away. MK Group once toured a buyer client through a single-family home in East Atherton listed at $13.5M. A front door facing a busy road was one of the reasons the client passed. The house later sold for $12M; MK was not a party to that sale.
Question three: how wide the spread already is in your sub-area
Once the neighbor's figure is adjusted, it still has to be tested against your sub-area. Price per square foot inside Palo Alto's sub-areas is already widely spread. The P75-to-P25 ratio is 1.28× in South Palo Alto, 1.34× in Old Palo Alto, 1.49× in Barron Park and 1.55× in Crescent Park. If your adjusted price per foot lands above your sub-area's P75, you need to be able to say what makes your home better than most of what has sold there. If you can't, the number is probably high.
How to adjust a neighbor's sale: item by item
The core figures first. Within the same sub-area, homes larger than the sub-area median sell for about 17% less per square foot. Homes built in 2000 or later sell for about 12% more at the same living area and lot. A sale from a year ago needs roughly a 10% upward adjustment, same quarter year over year. Homes in contract within two weeks closed at a median 109.1% of original list price, against 91.6% for homes on market 31 days or more. For each line, decide whether your home has more or less than the neighbor's, then adjust in that direction.
| Adjustment | Your home vs. the neighbor's | Which way your price per foot moves | Palo Alto data (single-family, Q3 2025–Q3 2026) | How to verify |
|---|---|---|---|---|
| Living area | Smaller | Higher; total price does not fall in proportion to size | In the same sub-area, homes above median size sell at about 0.83× the price per foot of the smaller half; 10% more living area means about 5.8% more total price | MLS living-area field, County Assessor records |
| Lot size | Larger | Higher, more so in sub-areas where land costs most | A 10% larger lot adds about 2.6% to total price; in Old Palo Alto, the larger-lot half carries about 21% more per foot (small sample) | County Assessor lot area |
| Lot shape | Narrow or flag lot | Lower | Not quantified in the data; see the Old Palo Alto narrow-lot case below | County Assessor parcel map |
| Age and move-in readiness | Newer, ready to move in | Higher | Same sub-area, living area and lot: homes built in 2000 or later sell for about 12% more in total | Year built, permit history, inspection reports |
| Basement | Has a basement | Align the definitions before comparing | Whether MLS living area includes the basement is inconsistent; not quantified in the data | Listing disclosures, County records |
| Road frontage | Front door faces a main road | Lower; a permanent discount | Not quantified in the data; see the East Atherton buyer feedback above | Check traffic and noise on site |
| Timing of sale | Neighbor closed a year ago | Adjust upward | Same sub-area, living area, lot and age: Q3 2026 ran about 10% above Q3 2025 | MLS close date |
| Days on market | Neighbor went into contract within two weeks | The neighbor's price includes a bidding premium | In contract within two weeks: median 109.1% of original list price; 31 days or more: 91.6% | MLS days on market and listing history |
What to remember: the magnitudes in this table come from a rough model that controls for sub-area, quarter, living area, lot size and building age (518 sales, log-linear, R² 0.83). Use them to judge direction and rough scale, not as a valuation formula. Condition, basement, road frontage, view and lot shape are not in the model; those have to be judged on site and sale by sale. The line most often underweighted is living area. Multiply the neighbor's price per foot by your square footage, and a smaller home will be undervalued while a larger one will be overvalued.
Wide spreads inside a single sub-area: Palo Alto price per square foot by MLS area
The core figures first. Across five quarters, the median price per square foot for Palo Alto single-family homes was $2,087. Among the 10 sub-areas with 20 or more sales, the P75-to-P25 ratio runs from 1.24× (Professorville) to 1.55× (Crescent Park). Old Palo Alto's median sale price was $7.8M, with price per foot at $1,902 at P25 and $2,540 at P75 — a ratio of 1.34×.
| MLS sub-area | Sales | Median sale price | $/sq ft P25 | $/sq ft median | $/sq ft P75 | P75 ÷ P25 |
|---|---|---|---|---|---|---|
| Old Palo Alto | 45 | $7.8M | $1,902 | $2,133 | $2,540 | 1.34 |
| Crescent Park | 37 | $6.4M | $1,720 | $2,206 | $2,657 | 1.55 |
| Community Center | 36 | $5.175M | $2,134 | $2,407 | $2,769 | 1.30 |
| Professorville | 23 | $4.923M | $1,850 | $2,143 | $2,303 | 1.24 |
| Barron Park | 48 | $4.34M | $1,548 | $1,882 | $2,308 | 1.49 |
| Green Gables | 55 | $4.2M | $1,966 | $2,198 | $2,463 | 1.25 |
| College | 32 | $3.79M | $1,848 | $2,087 | $2,411 | 1.30 |
| South Palo Alto | 120 | $3.478M | $1,798 | $2,023 | $2,304 | 1.28 |
| Midtown | 58 | $3.438M | $1,849 | $2,218 | $2,509 | 1.36 |
| Downtown Palo Alto | 21 | $3.05M | $1,733 | $2,046 | $2,353 | 1.36 |
What to remember: the band between the 25th and 75th percentile inside one sub-area is wide enough to move a price by millions. Take a 4,000 sq ft home in Old Palo Alto as an illustration: at the sub-area's P25 price per foot it comes to about $7.61M, at P75 about $10.16M — a gap of about $2.55M (illustrative arithmetic, not a valuation). Individual streets are even more dispersed. Of the 52 streets with three or more sales, 24 show a gap of more than 1.5× between their highest and lowest price per foot. Restrict the count to the 51 streets that sit within a single sub-area and the median is still 1.48×, so long streets crossing sub-area lines are not the main cause. Palo Alto Hills, Green Acres and Ventura had fewer than 20 sales and are not listed. For citywide figures by quarter, see MK Bay Area Pulse, Q3 2026: Palo Alto recorded 103 single-family sales in Q3 2026 at a median price of $4.2M, a median 107.6% of original list price and a median 9 days on market. That is the citywide pace, and it does not carry over to a single non-standard home.
What MK Group sees in practice
Two cases from the same Old Palo Alto street map directly onto this article's two points: a seller anchored by a same-street list price that was not comparable, and a price gap at a single location created by nothing more than lot shape.
A same-street list price became the seller's anchor: planned at $11M, closed at $10.3M
In the summer of 2026, MK Group represented a buyer family relocating from Southern California in an off-market purchase in the core of Old Palo Alto. The home was built after 2000, on a lot of about 7,500 sq ft, with more than 5,000 sq ft of living space and a basement. The seller had planned to list at $11M. Before signing, the seller saw a century-old house on the same street come to market at more than $8M, and called specifically to ask about it. That list price became his reference point.
Why would a list price below his own plan push his expectations up? Because that house was a teardown: $8M+ there was essentially buying land. A number like that is easy to read as "the land alone is worth this much." Stack a post-2000, 5,000-plus sq ft, move-in-ready house on top of that, and an $11M plan can easily start to look modest from the seller's chair. A nearby list price rarely affects a seller through the number itself. It works through how the number gets read.
That chain of reasoning does not hold. The $8M+ was a list price, not a sale. That lot was about 10,000 sq ft and long and narrow, while the seller's own lot was about 7,500 sq ft; with different sizes and shapes, the land value could not simply be carried across. The price was ultimately settled on three things: a condition-by-condition comparison between this house and recent nearby sales, the time and cost the seller would take on with a public listing, and the certainty of the buyer's funds and close. Kevin Mo led a negotiation of about 10 days, and the home closed at $10.3M — about $700K, or roughly 6.4%, below the seller's planned $11M. MK did not represent the seller and did not price the home for him. Seen from the buyer's side, the case shows that a non-comparable list price could not hold up the seller's expectations; what decided the negotiation was a set of adjusted closed sales.
Same location, a gap of close to $2M on lot shape alone, by on-site judgment
The century-old house on that same street sits on a long, narrow lot of about 10,000 sq ft and was listed at more than $8M. The on-site judgment of Marie Wang (DRE# 02110980) and Kevin Mo (DRE# 02127623) was that the same location on a regular lot could list at around $10M. Narrow lots are common in Old Palo Alto. The cost is restricted width; the compensation is a deeper, more usable backyard. That gap is an on-site judgment, not sales data, and it corresponds to the "lot shape" line in the adjustment table: a lot's value is not just its area. If the neighbor's lot is regular and yours is narrow or a flag lot, you cannot borrow the neighbor's price per foot even at the same lot area — and the same holds in reverse.
Common mistakes
Mistake one: "The neighbor sold high, so our whole street has gone up"
One sale cannot speak for a street. Pick any two sales on the same Palo Alto street and their price per square foot differs by a median of about 20%; roughly half the pairs differ by 20% or more (MLSListings, Q3 2025 through Q3 2026). A neighbor may have sold high because of a better lot, a fresh renovation, or several buyers bidding at once. To see whether prices have risen overall, look at year-over-year comparisons for the sub-area or the city. Controlling for sub-area, living area, lot size and building age, Q3 2026 ran about 10% above Q3 2025 — roughly half the median gap between two sales on the same street (about 20%).
Mistake two: "The neighbor listed at $10M, mine is similar, so $10M is a fair ask"
A list price is only what the seller asked, and at the top of the market it is often not where the home closes. Over five quarters, the 42 Palo Alto sales above $8M closed at a median 97.5% of original list price, and about six in ten sold below it (MLSListings). In the Old Palo Alto case above, the $8M+ house on the same street that the seller used as his reference was a list price, not a sale — and a teardown, not comparable to his post-2000, move-in-ready home. The right reference is a closed, recorded sale, adjusted for the differences.
Mistake three: "The neighbor's house is bigger, so I'll just multiply his price per foot by my square footage"
That undervalues a smaller home and overvalues a larger one. Within the same sub-area, homes larger than the sub-area median sell for about 0.83× the price per foot of the smaller half. An illustration from the rough model: the neighbor's 4,000 sq ft house sells for $10M, and yours is 25% smaller at 3,000 sq ft. Multiplying by price per foot gives $7.5M. The model points to a total price about 16% lower, or about $8.44M (illustrative arithmetic; lot, condition and other differences not included; not a valuation). Also confirm that both sides measure living area the same way on basements, or the price per foot is not comparable from the start.
Mistake four: "The neighbor was in contract in a week and sold over asking, so mine will move just as fast"
A fast sale usually carries a bidding premium in its price. Over five quarters in Palo Alto, homes in contract within two weeks closed at a median 109.1% of original list price; homes on market 31 days or more closed at 91.6% (MLSListings; correlation). In Q3 2026 the citywide median was 107.6% of original list price with a median of 9 days on market — the citywide pace. Homes above $8M had a median of 16 days on market and a median sale price below original list. The neighbor's speed depended on how many buyers were active at that moment, and the buyer pool may look different when you list.
Next steps
- Pin down the neighbor's sale: sale price or list price, close date, days on market, whether there was a price cut, and whether the MLS living area includes the basement. Take the sale price from the recorded transfer, not from the neighbor's word or an online estimate; the reasons are laid out in Can You Price a Bay Area Home Off Zillow or Redfin? Why Zestimate Misprices the $3M+ Luxury Tier.
- Pull the Santa Clara County Assessor's public records for both homes and compare lot area, parcel map and year built. Then work through the adjustment table above, marking where your home has more than the neighbor's and where it has less.
- Don't rely on the neighbor's sale alone. Find 3–5 sales in your sub-area from the past 6–12 months, choose those closest in living area, lot and age, and put the neighbor's sale in the same set. If your adjusted price per foot lands above the sub-area's P75, you should be able to explain why.
- When you discuss price with a listing agent, ask for every comp and every adjustment in writing, not just a single total. If several agents come back with numbers far apart, see I Interviewed Three Listing Agents for My Bay Area Home, and One Suggested a List Price $400,000 Higher Than the Other Two — Should I Sign With the Agent Who Quoted Highest?
- Set the list price inside the range your adjustments can defend, not at the neighbor's number. Listing high and cutting later usually costs more than listing a little lower; the data is in My $3M+ Bay Area Home Has Had No Offers After Two Weeks — If I Cut the Price, How Much of the Original List Price Will I Get?