Quick Answer
The cooling is real, but the three things that have historically caused a Bay Area crash — an equity crash, a rate shock, rising unemployment — were all absent in July 2026. What does change is supply: the 2020–2021 ARM cohort resets through 2026–2028, so inventory two years out is almost certainly wider. If you were already planning to sell, this year is the cleaner competitive field.
Who this article is for
- Peninsula and South Bay owners who already intended to sell and are weighing "list now" against "wait two years"
- Families holding a 5- or 7-year ARM taken out in 2020 or 2021, trying to understand what the reset does to their own math and to the wider market
- Readers who saw a "sales volume cut in half" headline and want to know how to read month-over-month and year-over-year separately
- Buyers working a $5M–$10M budget, judging whether there is still negotiating room in that band
- Buyers above $10M who want to know how the top of the market moves differently from the middle
- Anyone tracking why this correction is pushing Burlingame and Cupertino in opposite directions
Three ways to read this market
One: the cooling is real, but what narrowed is pricing tolerance, not price
Start with three July 2026 numbers for single-family homes in Santa Clara County and San Mateo County, side by side.
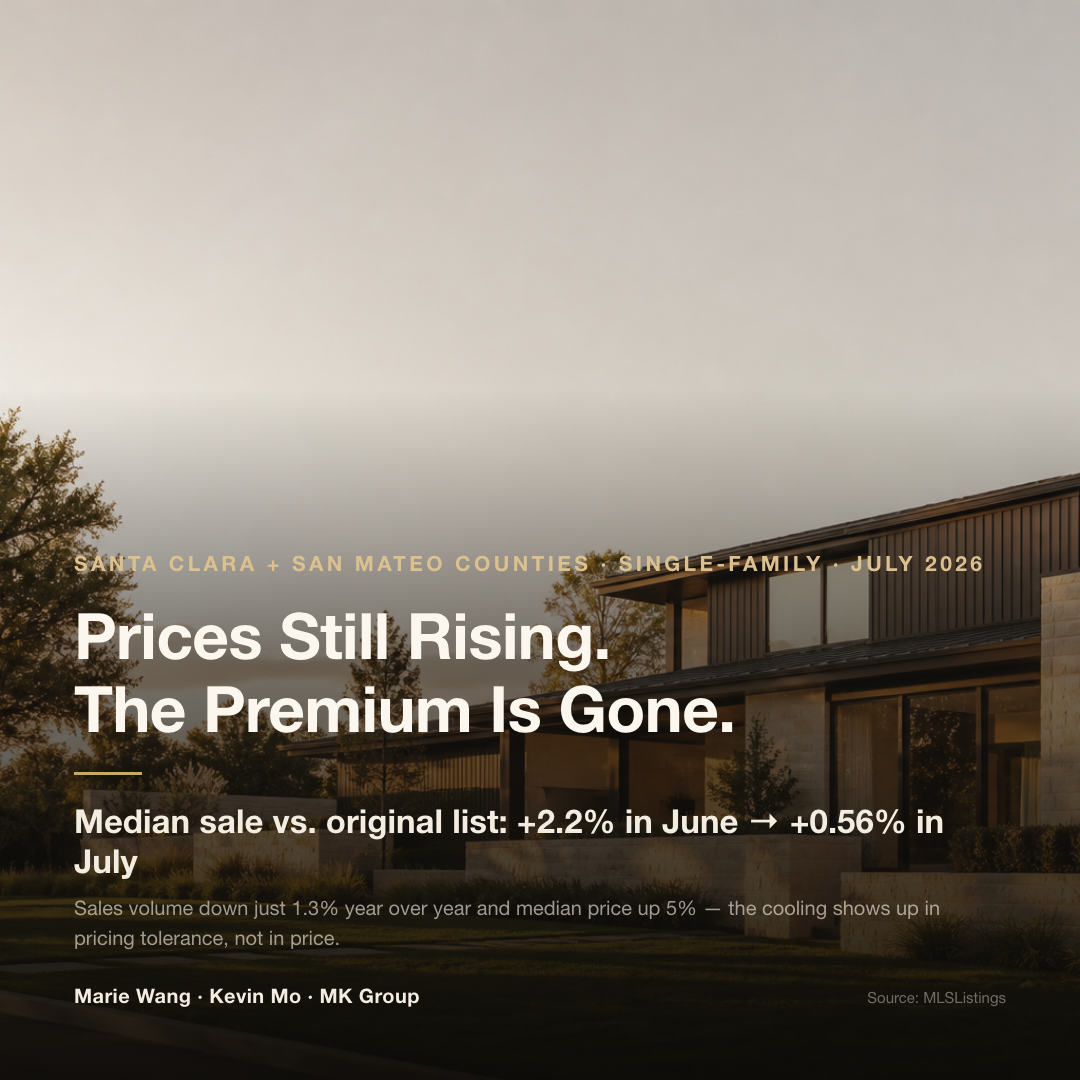
Sales volume fell 15% from June. On its own that sounds alarming. But measured against July of last year, the same pool of homes was down just 1.3%. Summer volume drops in the Bay Area every year — month-over-month reads the season, year-over-year reads the trend. And the median sale price is still rising: up 5% year over year.
The number that genuinely changed is the third one. The median sale price relative to original list price was +2.2% in June. In July it was +0.56%. That figure measures something other than price level. It measures how much room a seller has to be wrong. When the premium sits near zero, the market has stopped paying for pricing mistakes. Price high and the market does not climb up to meet you. It walks around you.
Put the three together and the signal is clear. Homes that sell fast still sell fast, and the number that sell slowly is visibly growing — the same shape every Bay Area correction has taken: core neighborhoods hold, edge locations sit noticeably longer. The hesitation is on the buyer side, not among forced sellers. And buyer hesitation makes homes sell slowly. It does not make prices collapse.
Two: a crash needs a trigger, and in July 2026 not one was present
Bay Area home prices have never simply drifted downward. Every deep decline arrived as a blow.
In 2000–2002 the Nasdaq lost 80% of its value. A large share of down payments in this region came out of equity, so when the equity evaporated, the buyer and the down payment disappeared together. In 2022 the 30-year fixed mortgage went from roughly 3% to roughly 7% inside a single year and buyers were pushed straight out of the market. In 2008 San Francisco single-family prices posted three consecutive down quarters for the first time in a decade, reaching about −23% at the trough, and the order of events ran the other way: mortgages defaulted first, prices fell second, and the equity market was dragged along behind. The one thing all three share is that the trigger came before the decline. A market that merely gets colder does not produce numbers like these. (The transmission mechanism and repair time for each of those three episodes is broken down further in If the AI Bubble Bursts, Will My Bay Area Home Lose Value?)
Now hold each trigger up against July 2026.
- An equity crash? No. The Nasdaq was roughly flat over the month and the S&P 500 was up about 3%.
- A rate shock? No. The 30-year fixed mortgage moved from 6.43% at the start of July to 6.66% at the end — a modest climb, and nothing like the near-doubling of 2022.
- Unemployment? Least of all. The Bureau of Labor Statistics put the June unemployment rate at 4.2%, and initial jobless claims in the week of July 18 came in at 187,000, close to a 60-year low. Mortgage delinquencies showed no unusual rise over the same period and remain inside their normal historical range; the MBA national delinquency survey's long-run average sits near 5.2%.
The chain works in a fixed order. People lose jobs, then mortgages go unpaid, then forced sellers appear, then prices break. The Bay Area today has almost no forced sellers. So the answer to the first question is straightforward: the cooling is real, and the conditions for a crash are not currently in place.
Three: the most predictable change in 2027–2028 sits on the supply side
Nobody can tell you whether demand will be stronger two years from now. But one thing on the supply side is visible in advance.
In 2020 and 2021, a group of households took out adjustable-rate mortgages at very low rates, mostly on 5- and 7-year terms. Those loans reset between 2026 and 2028, with the payment recalculated at whatever the rate is on the reset date. Some of those households have since moved and kept the original house as a rental. Holding it made obvious sense at a payment built on a rate just above 3%; once it resets above 6%, the arithmetic stops working for a share of them. That share starts selling — and arrives in the same window.
When sellers cluster, two things follow.
- Neighborhood comparables move down. A few extra sales on the same street change the anchor that both buyers and appraisers are working from.
- Buyers suddenly have more to choose from. A budget that used to see three options now sees eight, and the attention each listing receives gets thinner.
One line needs to be drawn clearly here: this is wider supply, not falling prices. Those are not the same claim. If demand strengthens over the same window, prices can hold. But for an owner who already intended to sell, the decision does not require a price forecast at all. Today's market is the market before that group arrives. Either sell while they are still holding, or wait two years and face more inventory against less certain demand. That is a timing question, not a prediction question.
City by city: this correction is not moving in one direction
The core numbers first. On a January–July 2026 cumulative basis versus the same period last year, Burlingame's median sale price moved from about $3.00M to about $3.26M, a gain of roughly 8.8%. Los Altos is roughly flat and Los Gatos is slightly down. Cupertino moved from about $3.50M to about $3.35M — the only higher-volume city in this pull to fall more than four points on the January–July cumulative basis.
| City | Median sale price, Jan–Jul 2025 | Median sale price, Jan–Jul 2026 | Year-over-year direction |
|---|---|---|---|
| Burlingame | about $3.00M | about $3.26M | up about 8.8% |
| Los Altos | — | — | roughly flat |
| Los Gatos | — | — | slightly down |
| Cupertino | about $3.50M | about $3.35M | down more than 4% |
Basis: Santa Clara County and San Mateo County single-family homes, January–July 2026 versus the same period in 2025. The cumulative basis is used because single-month samples in these cities are small enough that one or two sales can pull the median around.
Two things to carry away. First, this is a citywide median. It is not your house, and it is certainly not your street. Inside a single city, different attendance areas and different lot conditions can move in opposite directions, and using a citywide median to infer what your own home is worth is the single most common misuse of this data. Burlingame sits on the northern Peninsula; Cupertino is in the South Bay — even the regional label does not carry across a city line, let alone a street.
Second, why the market is splitting at all. The equity hammer did not fall, but equity gains have been concentrated in a small number of companies, and the new money sits with employees at those same companies. The cities those buyers shop have held firmly. Cities like Cupertino and Los Altos, which already ran up hard over the preceding few years, are a different case: price growth cannot diverge from real purchasing power indefinitely.
Price band by price band: $5M–$10M and $10M+ are two different markets
The core numbers first. In July 2026, the $5M–$10M band closed at a 9-day median — the fastest of the four bands — with a median premium of zero. In the same month, above $10M there were only 18 closings, a 26-day median, half the listings past 30 days on market, and a median sale price 5% below original list.
| Price band (July 2026) | Median days on market | Median premium over original list | Share listed more than 30 days | Closings in the month |
|---|---|---|---|---|
| $5M–$10M | 9 days | 0 (sale price roughly equals list price) | close to 30% | — |
| $10M+ | 26 days | median sale 5% below original list | about half | 18 |
Basis: Santa Clara County and San Mateo County single-family homes, July 2026 alone. With only 18 closings above $10M in the month, that band's medians are highly sensitive to individual transactions.
The combination worth remembering is "9 days and zero premium." It looks contradictory. If homes are selling that fast, why is nothing being bid up? Because this band generally prices transparently. Sale prices track list prices closely, so demand strength shows up in speed rather than in premium. That compresses the seller's margin for error down to a single task: get the price right the first time. The close-to-30% of listings in the same band sitting past 30 days are the ones where the price was not right. They are not selling slowly. They have dropped into a different track.
Above $10M the rhythm is entirely different. Eighteen closings means the band is thin by construction, and a 26-day median with a sale price 5% under original list says there is genuine negotiating room on both sides. That room is not evidence that the market is breaking. It is the natural product of thin volume plus ambitious initial pricing.
What MK Group sees in the field
Pricing right once is worth far more than "list high and see what happens"
Every year sellers ask the same question: can we list a little high, and cut later if it doesn't sell? The MK Group team talks them out of it every time. The cost is not the price difference. The cost is that the house falls out of one track and into another.
A newly listed home reads as new, and the first buyer instinct is competitive: someone else might take it. If the home is still sitting after a month, that instinct changes to something else entirely — what is wrong with this house — and the offers come in far below. Once a listing crosses from the first track into the second, it is very hard to get back. That close-to-30% figure, listings past 30 days in the $5M–$10M band, is where those homes end up.
An Atherton off-market sale: priced right from day one, nothing renovated
In July 2026, MK Group (Marie Wang and Kevin Mo) acted as exclusive agent on an $8M off-market sale in Atherton. The sellers had been living outside the Bay Area for years and were no longer using the house.
The property dated to the 1940s or 1950s, Spanish in style, and the insulation, pool, grounds and heavy tree cover all needed work. On the public-listing path, prep and presentation would have taken at least six weeks — and the sellers were living far from the Bay Area, in no position to supervise contractors or accommodate showings.
The team's read was that the real value sat in the land, not the structure. The parcel has three points of access, which gives an experienced developer far more to work with on a replan. On that basis the target buyer changed from an owner-occupant to a well-capitalized local developer — a buyer purchasing redevelopment potential, indifferent to the condition of the existing house, with no reason to wait for a listing date.
The transaction closed off-market before any listing preparation began. The sellers flew back to sign. The six weeks of prep and the remote project supervision they never had to do were part of the value of the deal, not a footnote to it.
This was an off-market sale, but it makes the same point. Off-market has no "list high and see" option. Price it wrong and there is no transaction at all. Choosing the public-listing path only raises the stakes on getting that first number right. Kevin Mo runs a monthly Bay Area market data review on YouTube @KevinMoRE (23K+), and this is one of the conclusions that has held up repeatedly over the past two years.
Common Misconceptions
"July volume fell 15% from June — is the market breaking?"
Month-over-month and year-over-year answer two different questions. In the same dataset, July volume was down 15% from June but only 1.3% from July of last year, and the median sale price was still up 5% year over year. Summer volume declines are seasonal in the Bay Area, and using month-over-month to read trend will point you in exactly the wrong direction. What deserves attention is not the monthly swing in volume. It is the change in premium — sale price relative to original list — and the distribution of days on market.
"Buyers are hesitating, so prices will come down"
Hesitation does not produce a crash. It produces slower transactions and longer days on market, not falling prices, because nobody is being forced to sell. Prices break when forced sellers appear, and forced sellers come from job loss and mortgage default. June's unemployment reading was 4.2%, initial jobless claims in mid-July were near a 60-year low, and mortgage delinquencies remained inside their normal historical range. The first link in that chain has not started.
"The citywide median fell, so my house fell too"
It does not follow. Cupertino's January–July cumulative median moved from about $3.50M to about $3.35M, but that is a citywide figure blending different attendance areas, lot conditions and vintages — and a shift in the mix of what sold can move a median by itself. Inside one city, a strong parcel and an ordinary one can move in opposite directions. To judge your own home, use comparable sales in the same attendance area, on comparable land, in comparable condition. Not the city median.
"If there will be more inventory in 2027, I should just wait and buy cheaper"
The ARM reset widens supply. It does not guarantee lower prices. Two years out a buyer may face more choice and more negotiating room, but also a less certain demand environment and a rate path nobody can forecast. The more practical approach is to read the bands as they are now: at $5M–$10M the median is 9 days and the good houses will not wait for you; above $10M there were 18 closings in the month with half the listings past 30 days, so the negotiating room is already there. Substituting "wait two years" for "make a band-level judgment today" trades an answerable question for an unanswerable one.
"I'll list high — I can always cut the price later"
A price cut is not a reversible move. Once a home goes from newly listed to still-sitting-after-a-month, the buyer's mental frame has already switched — from "someone else might take it" to "something must be wrong with it." The offers that arrive after the cut are frequently lower than what the home would have closed at if it had been priced correctly on day one. In a band where the median premium is zero, that experiment is especially expensive.
Next steps
- If you already intended to sell, evaluate the timing window as its own variable. The 2027–2028 ARM reset wave will widen supply, and it is the only structural change currently visible in advance. The question is not "will prices fall" but "will there be more competing inventory in my price band two years from now."
- If you are preparing to list, put all of your energy into getting the first price right. In a band where the median premium is zero, the market will not pay for an ambitious number. Have your agent price from comparable sales in the same attendance area on comparable land — and skip the "list high and see" experiment entirely.
- If you are buying between $5M and $10M, run two different plays. On new listings, bid a fair number and do not chase. On listings past 30 days, negotiate seriously — close to 30% of this band has been sitting that long, and those sellers are usually more willing to move.
- If you are buying above $10M, set your pace from that band's own data. A 26-day median, half the listings past 30 days, and a median sale price 5% below original list means there is time for full diligence and multiple rounds of negotiation. There is no reason to decide at the mid-band's pace.
- Track two sets of indicators each month and ignore the headlines. One is the unemployment rate and initial jobless claims; the other is mortgage delinquency. Those are the links that turn cooling into decline. Everything above applies to the current market only: two consecutive months of sharply rising unemployment, or another fast run-up in mortgage rates, would change the conditions and require reassessing these conclusions.
Further reading: If the AI Bubble Bursts, Will My Bay Area Home Lose Value? | Prices Are Falling Across the Country and the Buyer's Market Is Back — Can I Finally Buy the Dip in the Bay Area?