This Pulse issue analyzes 2,902 single-family residential closings across three core Bay Area counties (San Mateo, Santa Clara, Alameda) in Q1 2025, covering roughly 50 cities. Three headline findings: amid a rate-rebound and equity-correction quarter, mid-tier school-zone ($1.5M–$5M) closed at median 108% sale-to-original — the spring FOMO peak of 2025; $10M+ ran 77–100% all-cash, structurally decoupled from rate direction; only 2 $20M+ closings region-wide, both Atherton all-cash, median DOM 79.5 days with sale-to-original just 90.7% (seller-concession pattern). Sourced from MLSListings and FRED macroeconomic indicators.
Scroll the PDF for the full report; the web version below adds clickable links and embedded charts.
- Q1 was the most macro-hostile quarter of 2025 (rate rebound +20 bps, S&P 500 −4.59%), yet mid-tier school-zone ($1.5M–$5M) closed at median 108% sale-to-original — the tightest spring FOMO reading of the year.
- $10M–$20M ran 76.9% all-cash and $20M+ was 100% all-cash — luxury cash dominance was already a structural fact in Q1 at the 6.83% rate peak, entirely unrelated to mortgage conditions.
- Only 2 $20M+ closings regionwide, both in Atherton: median DOM 79.5 days, sale-to-original just 90.7% — a seller-concession clearance pattern, the inverse of the same quarter's mid-tier over-bidding.
1. The 30-Second Read
This issue draws on 2,902 single-family residence (SFR) closings in the Bay Area during Q1 2025 (CloseDate January 1 through March 31), spanning San Mateo, Santa Clara, and Alameda counties, with roughly 50 cities represented. Data sourced from MLSListings and Bay East / Contra Costa AOR.
- Q1 SFR aggregate median sale price roughly $1.50M, median days on market 7-10, median sale-to-original 106-108% — closing velocity tight, over-bid intensity higher than market intuition for a "high-rate quarter."
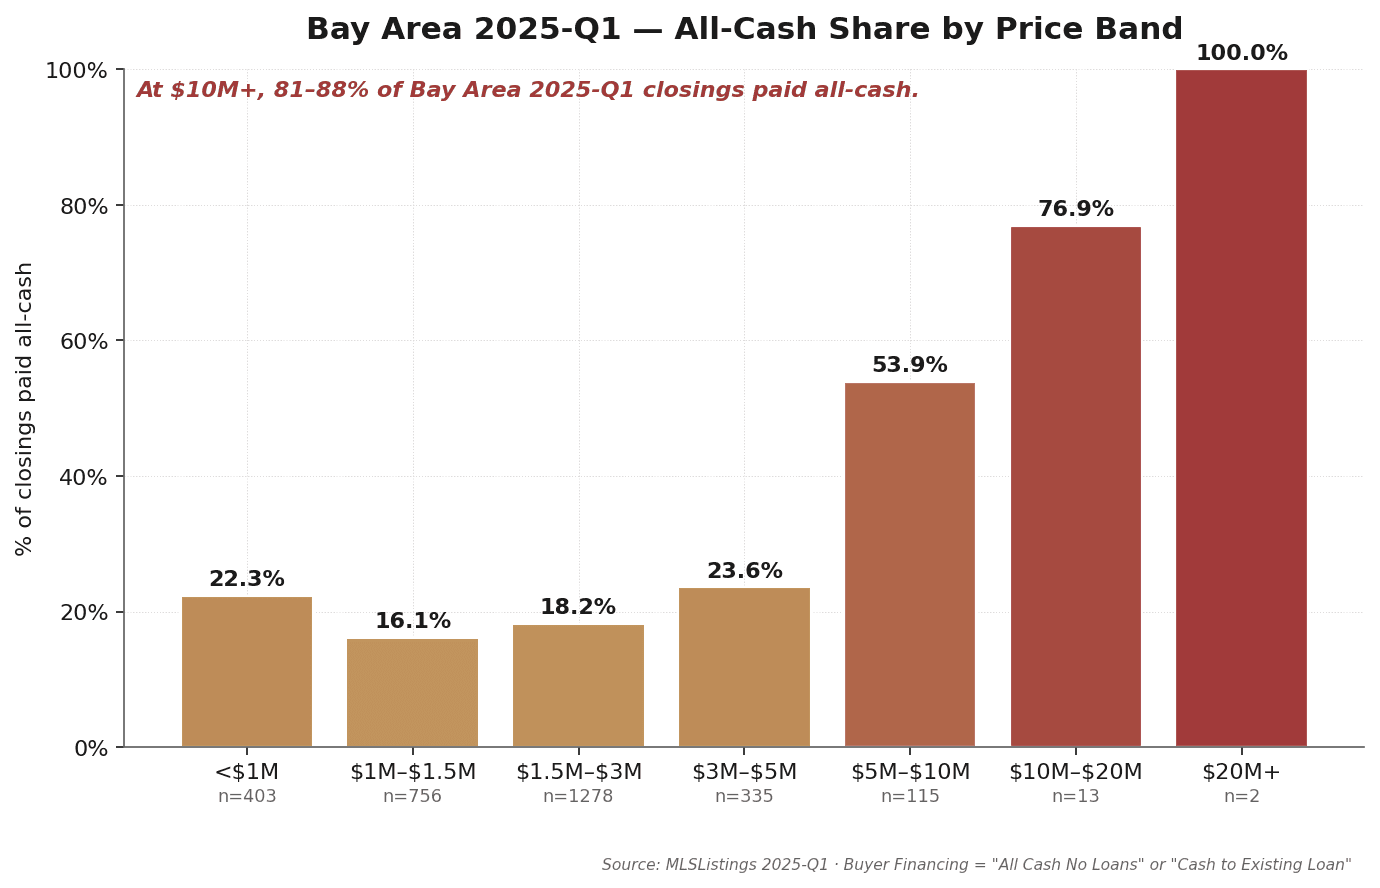
- All-cash share rises step-wise with price: under $1M, 22.3%; $1M-$3M, 16-18%; $3M-$5M, 23.6%; $5M-$10M, 53.9%; $10M-$20M, 76.9%; $20M+, 100%.
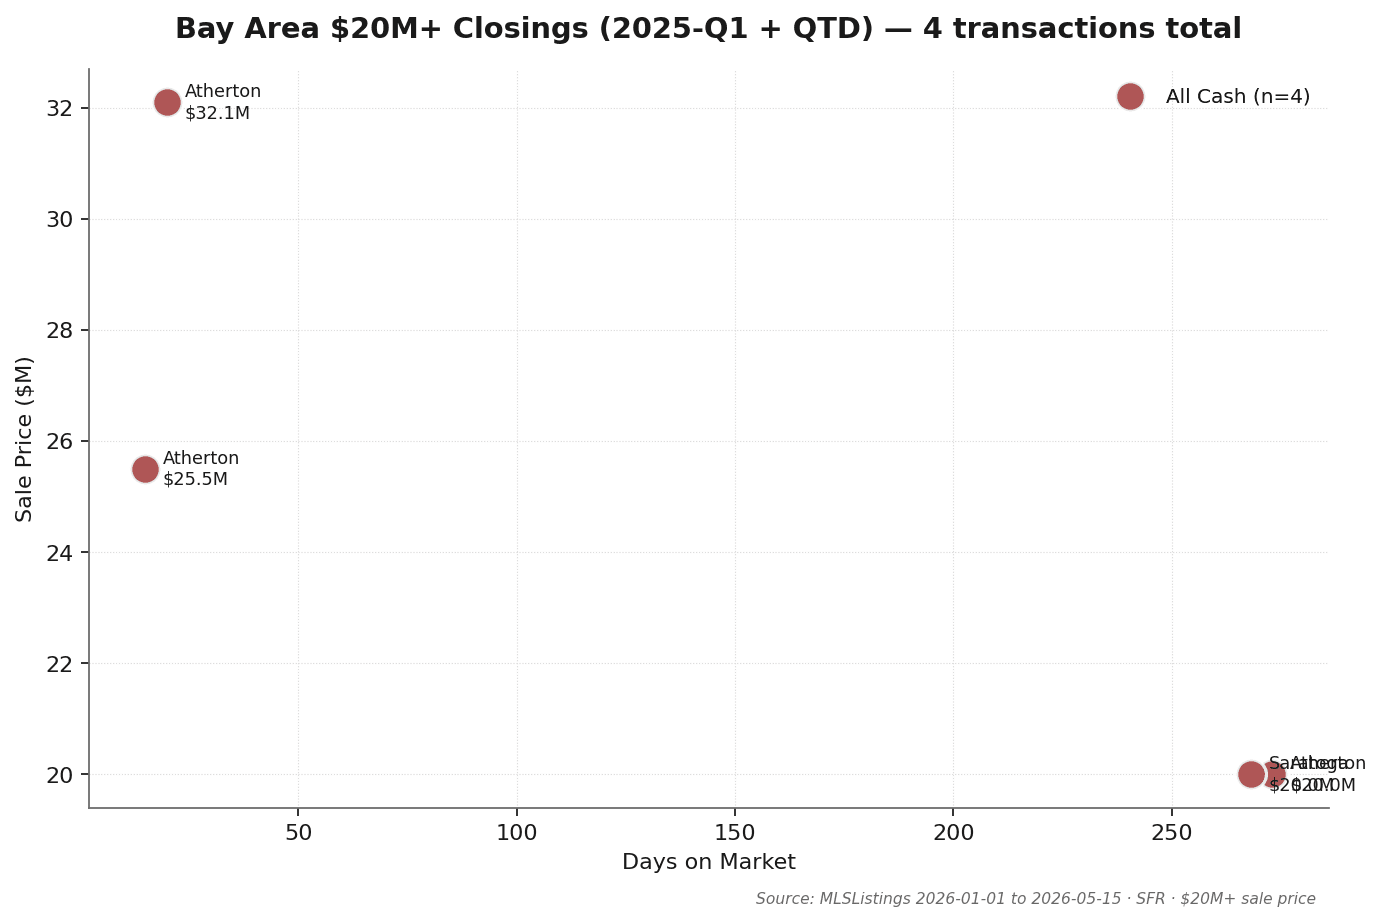
- $20M+ closings region-wide totaled just 2, both in Atherton, both all-cash: 178 Patricia DR at $25.5M (DOM 15) and 323 Walsh RD at $20.0M (DOM 273, cut $3.5M from $23.5M original list).
- 30-year fixed mortgage averaged 6.83% in Q1, +20 bps QoQ — a rate-rebound quarter, contrary to the popular "early-2025 rates will ease" expectation.
- S&P 500 closed the quarter at 5,611.85, −4.59% QoQ — the largest equity correction of 2025.
- Yet mid-tier school-zone was the tightest: $1.5M-$3M band saw 1,278 closings, sale-to-original 108.0%, DOM 8 days; $3M-$5M band 335 closings, 108.6%, DOM 7 days — the spring buying window converged with rate-anxiety FOMO.
Source: MLSListings + Bay East / Contra Costa AOR Q1 2025 SFR closings · MK Group · Field definitions in Section 8.
2. Bay Area Fundamentals: Four Baseline Numbers
Q1 2025 Bay Area SFR market is summarized most accurately by four numbers:
| Metric | Q1 2025 Median | Interpretation |
|---|---|---|
| Total closings | 2,902 | San Mateo + Santa Clara + Alameda combined |
| Aggregate median sale price | ~$1.50M | All price bands aggregated |
| Median DOM | 7-10 days | List date to offer acceptance |
| Median sale-to-original | 106-108% | Active over-bid seller's market |
Together these four numbers point to one read: Q1 2025 was the most macro-hostile quarter but had the most active micro over-bidding of 2025. With rates rebounding from 6.63% to 6.83% and the S&P 500 down 4.59%, macro intuition would predict cautious buyers and conceding sellers. The actual data is the opposite: median DOM only 7-10 days, median sale-to-original generally 106-108% — meaning homes typically went into contract within a week and at 6-8% over original list. This "macro headwind + micro over-bidding" combination is Q1's most notable feature.
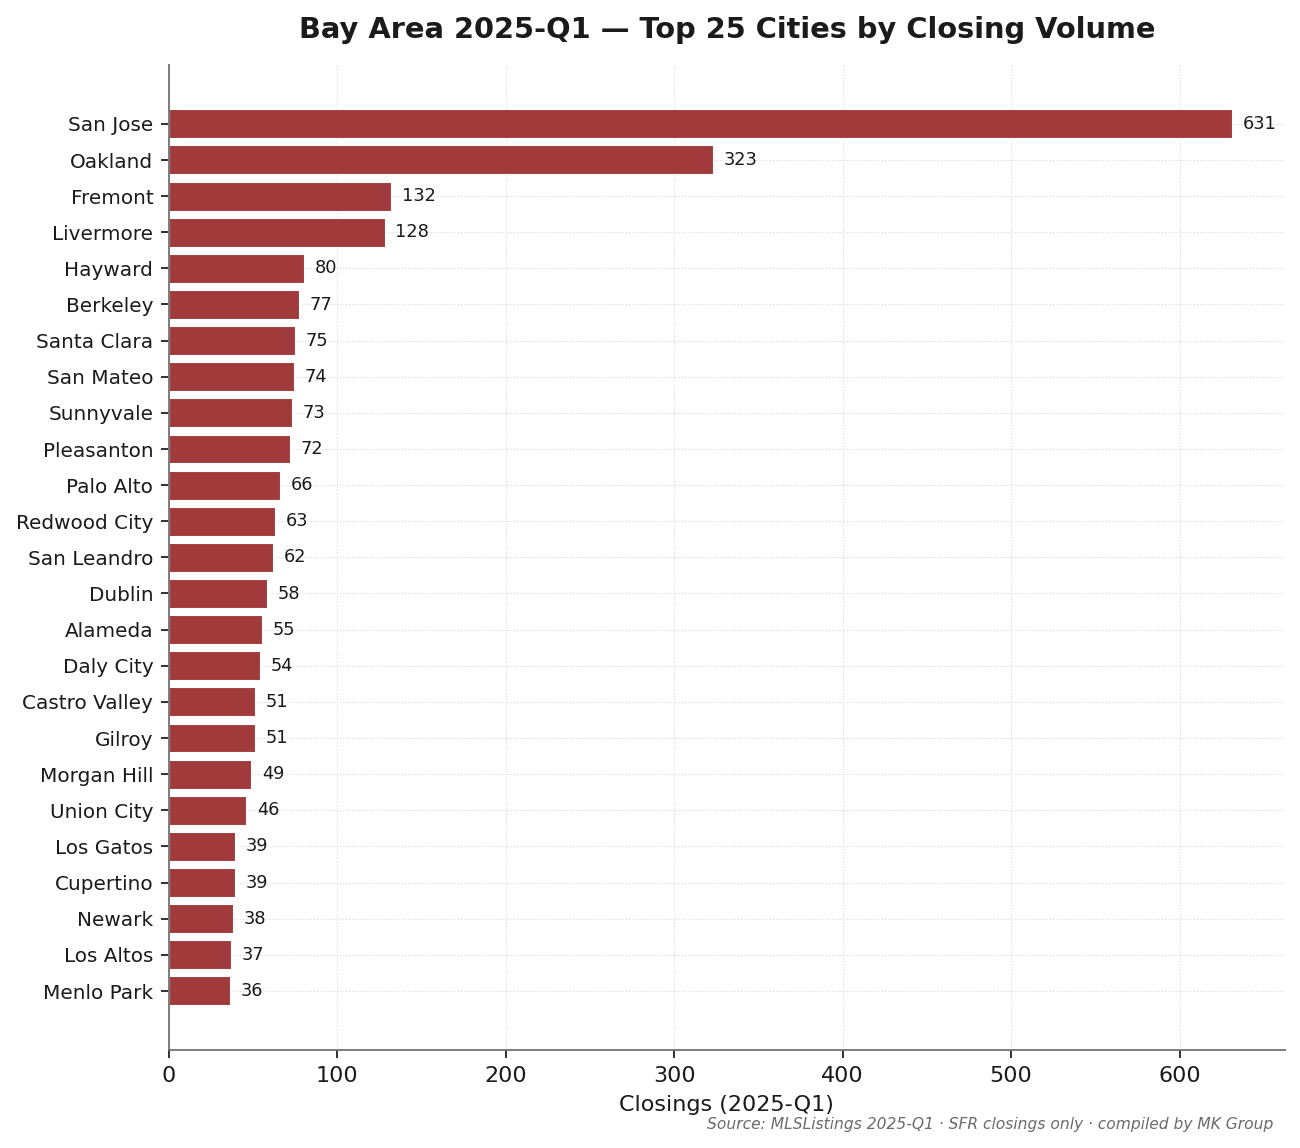
San Jose recorded 631 Q1 closings — ~22% of the three-county total. Oakland (323), Fremont (132), Livermore (128), Hayward (80), Berkeley (77), Santa Clara (75), San Mateo (74), and Sunnyvale (73) follow. Among MK Group's core service cities: Palo Alto 66, Redwood City 63, Cupertino 39, Los Altos 37, Menlo Park 36, Saratoga 35, Atherton 15 — low volume but concentrated in the $3M-$10M+ tiers.
Source: MLSListings + Bay East / Contra Costa AOR Q1 2025 SFR closings · excludes condo, multi-family, and records with sale price below $100K.
3. The Cash Ladder: Luxury Cash Dominance
| Indicator | Quarter | vs Prev Q | YoY |
|---|---|---|---|
| 30-yr fixed mortgage avg | 6.83% | +0.20 pp | +0.08 pp |
| 15-yr fixed mortgage avg | 6.02% | +0.19 pp | −0.03 pp |
| 10-yr Treasury yield avg | 4.45% | +0.18 pp | +0.30 pp |
| CA unemployment rate | 5.40% | 平稳 | +0.27 pp |
| S&P 500 close (period-end) | 5,611.85 | −4.59% | +6.80% |
| Case-Shiller SF HPI | 357.9 | −0.98% | +1.53% |
Sources: Freddie Mac PMMS / U.S. Treasury / BLS / S&P Global / S&P CoreLogic via FRED public API
The Q1 macro backdrop delivers three concentrated headwinds. The 30-year fixed mortgage of 6.83% rebounded 20 bps QoQ — the highest opening rate level of 2025. The S&P 500 fell 4.59% intra-quarter — the largest equity correction of 2025. California unemployment ticked up 27 bps YoY, with the labor market showing modest softening. Case-Shiller SF MSA home price index dipped 0.98% QoQ but remained +1.53% YoY — flat-to-soft regionally, not in genuine decline. Q1 was the most macro-hostile quarter, yet the local market's over-bid intensity ran highest.
| Price band | Closings | Cash % | Median sale | DOM | Sale/orig |
|---|---|---|---|---|---|
| <$1M | 403 | 22.3% | $800K | 13 | 100.5% |
| $1M–$1.5M | 756 | 16.1% | $1.26M | 10 | 106.5% |
| $1.5M–$3M | 1,278 | 18.2% | $1.93M | 8 | 108.0% |
| $3M–$5M | 335 | 23.6% | $3.58M | 7 | 108.6% |
| $5M–$10M | 115 | 53.9% | $6.00M | 8 | 101.4% |
| $10M–$20M | 13 | 76.9% | $12.10M | 16 | 94.7% |
| $20M+ | 2 | 100.0% | $22.75M | 144 | 90.7% |
Observation 1: $10M+ was already structurally cash-dominated in Q1
Q1's $10M-$20M closings were 77% cash (10 of 13); $20M+ closings were 100% cash (2 of 2). These shares are essentially identical to Q2 2025 ($10M-$20M 77.8%, $20M+ 66.7%) — meaning the luxury tier's low credit dependence was a structural fact in Q1 2025, not a new phenomenon emerging in later quarters. Even at Q1's 6.83% rate level, luxury closings transmitted virtually nothing from the rate environment.
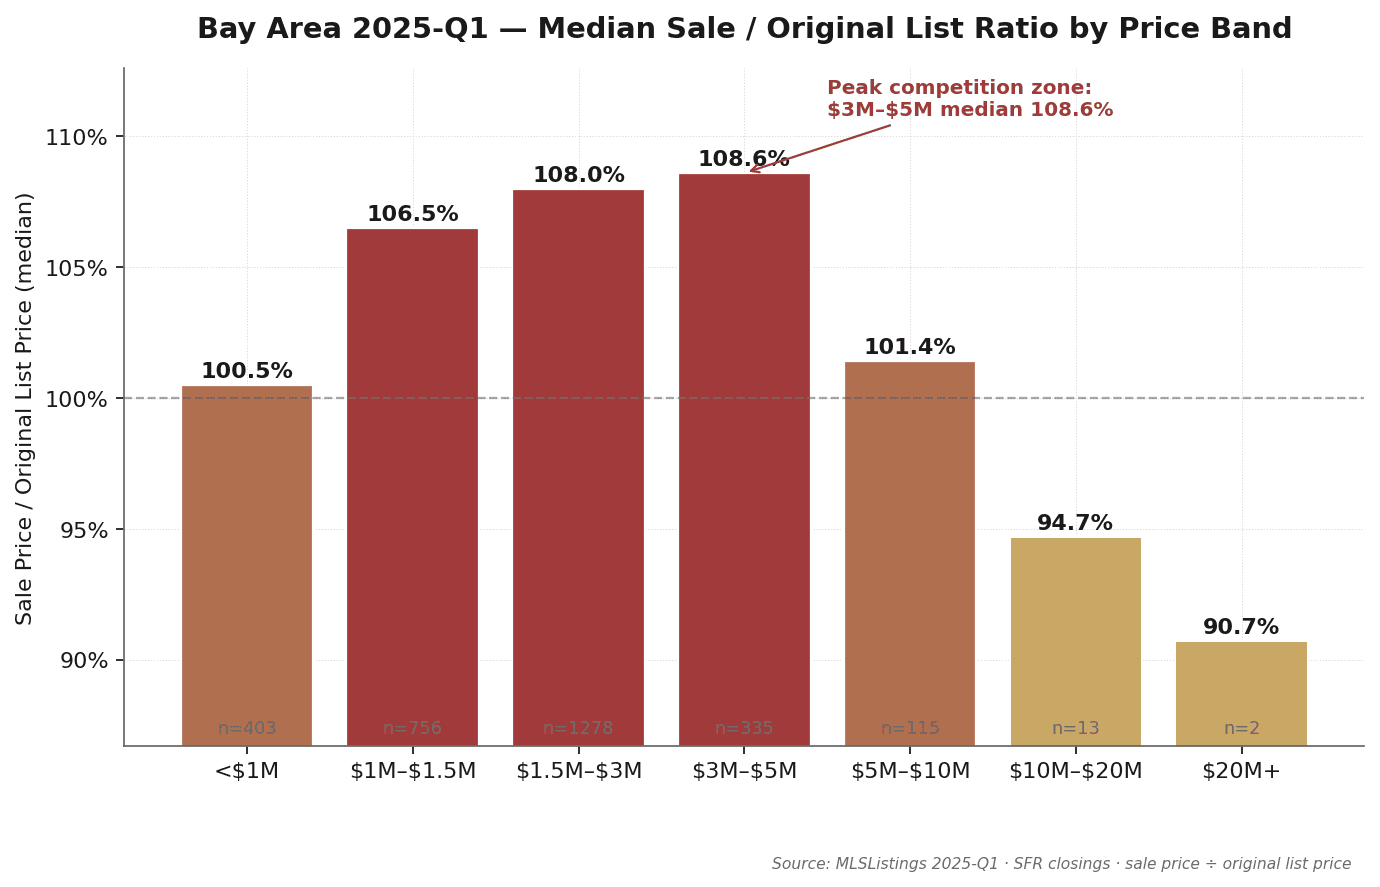
Observation 2: $3M-$5M sale-to-original of 108.6% was the highest of any band
Q1's $3M-$5M band recorded 335 closings with a median sale-to-original of 108.6% — the highest relative premium across all bands. Median DOM just 7 days. This band concentrates heavily in Palo Alto, Menlo Park, Los Altos, Saratoga, and Cupertino — the Bay Area's premium school cores. In a quarter of rate rebound and equity correction, school-zone buyers pushed closes 8-9% above original list.
Observation 3: $20M+ sale-to-original of 90.7% is the contrarian signal
Q1's $20M+ band closed at a median sale-to-original of just 90.7% — original list ran roughly 10% above final sale. Q1's ultra-luxury sellers listed high, then required extended DOM and meaningful price cuts to close — exactly the opposite of the $3M-$5M band's 108% over-bid behavior.
Source: MLSListings + Bay East / Contra Costa AOR Q1 2025 · Buyer Financing field "All Cash No Loans" or "Cash to Existing Loan" classified as cash.
4. Mid-Tier: Spring Rate-Anxiety Meets School-Zone FOMO
The $1.5M-$3M and $3M-$5M bands together produced Q1 2025's tightest reading: median sale-to-original 108% + DOM 7-8 days — the strongest mid-tier prints of the year. Together they accounted for 1,613 Q1 closings, roughly 56% of three-county volume.
The data
The $1.5M-$3M band saw 1,278 Q1 closings with a median sale-to-original of 108.0% and DOM 8 days. The $3M-$5M band recorded 335 closings with median sale-to-original of 108.6% and DOM 7 days. Combined, the two bands made up 1,613 Q1 closings or ~56% of three-county volume. The $1M-$1.5M band's 106.5% sale-to-original and 10-day DOM was nearly as tight. The bottom band (<$1M) closed at just 100.5% sale-to-original — over-bid intensity increased with price band up to $3M-$5M peak, then receded into the $5M+ cash tiers where the dynamic shifted to seller concession.
Why mid-tier ran tightest in the most macro-hostile season
The $1.5M-$5M buyer profile is highly homogeneous: age 30-45, mid-level managers or senior engineers at FAANG/AI companies, RSU or pre-IPO equity exposure, children in elementary or middle school with hard school-zone requirements, household income $400K-$1M with DTI flexibility compressed by the 6.83% rate environment. This cohort faced two converging forces in Q1: (1) the spring buying window — need-driven buyers cannot defer the school-year-aligned decision to the second half; (2) rate-rebound FOMO — when Q1 rebounded to 6.83%, the prevailing read became "if I don't lock now, it'll be more expensive later." Together these forces pushed Q1 mid-tier school-zone over-bidding to the year's high.
Source: MLSListings + Bay East / Contra Costa AOR Q1 2025 · Sale Price ÷ Original List Price, median (not mean).
5. $20M+ Ultra-Luxury: Two Atherton Clearance Closings
Only 2 SFR transactions above $20M closed across the entire Bay Area in Q1 2025 — the lowest quarterly $20M+ count of the 2025 series. Both were in Atherton's 94027 ZIP, and both were all-cash. The most striking shared feature is extended DOM combined with meaningful price cuts — a textbook clearance pattern.
Q1 transaction detail (2 closings)
| City | Address | Sale | Orig List | DOM | Cash | Close |
|---|---|---|---|---|---|---|
| Atherton | 178 Patricia DR | $25.50M | $26.50M | 15 | ✓ | 2025-03-14 |
| Atherton | 323 Walsh RD | $20.00M | $23.50M | 273 | ✓ | 2025-01-17 |
Three observations
Observation 1: Both closings in Atherton's 94027 ZIP. Q1's $20M+ geographic concentration is extreme — both transactions came from the same Atherton ZIP (94027). Atherton's overall Q1 numbers — 15 closings, $8.20M median, 86.7% cash — make it the Bay Area's most cash-dominated luxury anchor of the quarter. When ultra-luxury transaction volume thinned out, Atherton was effectively the only $20M+ submarket still moving inventory.
Observation 2: 323 Walsh RD's 273-day DOM was Q1's most extreme clearance case. The property was first listed in April 2024 at $23.5M, and closed on 2025-01-17 at $20.0M — nearly nine months from list to close, with a final price cut of $3.5M (−14.9%). A 273-day DOM shows what Q1 ultra-luxury closing velocity actually looked like — a single transaction could require close to a year of negotiation.
Observation 3: 178 Patricia DR was Q1's only "clean structure" $20M+ closing. Originally listed at $26.5M, it closed in just 15 days at $25.5M — sale-to-original 96.2%, a discount of only 3.8%. Even then, it closed below list, not above. Q1's ultra-luxury norm was "sellers concede, buyers control the cadence" — the inverse of mid-tier's 108% over-bid behavior.
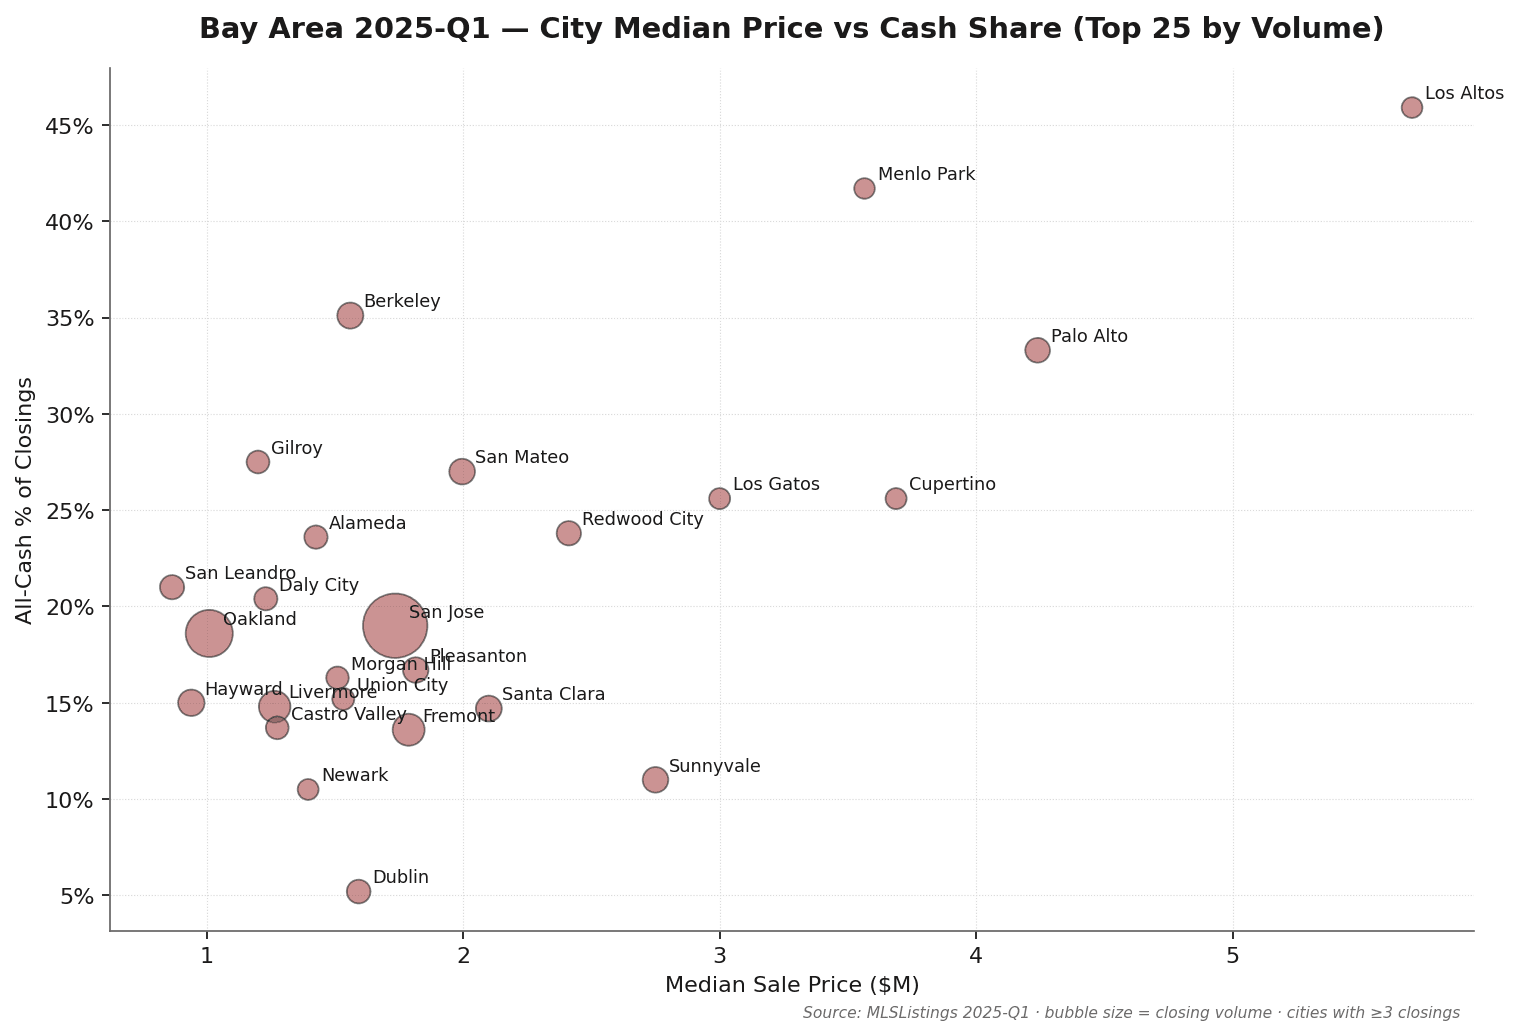
6. City Tiers: Six Groups, Six Narratives
Plotting Q1 data by city (median price × cash share × volume) surfaces six distinct city groups.
Tier 1 · Ultra-Luxury Anchor (Atherton / Hillsborough / Los Altos Hills / Woodside / Portola Valley)
Shared profile: median sale price $4.6M+, cash share 33–87%, low transaction count. Atherton Q1: 15 closings, $8.20M median, cash 86.7% (Bay Area's highest Q1 cash-share city). Hillsborough: 15 closings, $5.60M, cash 33.3%. Los Altos Hills: 13 closings, $5.56M, cash 53.8%. Woodside: 9 closings, $4.64M, cash 44.4% (DOM 35 — slowest among the luxury anchors). Portola Valley: 10 closings, $4.67M, cash 40.0%. Off-market share is high; standard MLS data understates true activity. Both Q1 $20M+ closings landed in Atherton's 94027 ZIP.
Tier 2 · Premium School-District Core (Palo Alto / Los Altos / Menlo Park / Saratoga / Cupertino)
Median sale $3.57M–$5.70M, cash share 22–46% — the most striking sale-to-original group in Q1. Palo Alto Q1: 66 closings, $4.24M median, cash 33.3%, sale/orig 108.9%, DOM 7. Los Altos: 37 closings, $5.70M, cash 45.9%, sale/orig 108.1%, DOM 8. Menlo Park: 36 closings, $3.57M, cash 41.7%, sale/orig 106.2%, DOM 8. Saratoga: 35 closings, $4.15M, cash 22.9%, sale/orig 103.9%, DOM 7. Cupertino: 39 closings, $3.69M, cash 25.6%, sale/orig 113.0%, DOM 7 (highest sale/orig among the school cores). Premium school cores closed at sale-to-original 106–113% in a quarter of rate rebound and equity correction — the "upper half" of the K-shape divergence.
Tier 3 · Tech Corridor Core (Sunnyvale / Mountain View / Santa Clara / Fremont)
Median $1.79M–$2.76M, dense AI/FAANG employee buyer base. Sunnyvale Q1: 73 closings, $2.75M median, cash 11.0%, sale/orig 118.2%, DOM 7 — the tightest tech-corridor city in Q1 (sale/orig second-highest in the Bay Area behind Berkeley's 118.7%). Mountain View: 32 closings, $2.76M, cash 15.6%, sale/orig 106.4%. Santa Clara: 75 closings, $2.10M, cash 14.7%, sale/orig 111.9%. Fremont: 132 closings, $1.79M, cash 13.6% — highest volume in the corridor, lowest cash share, most directly exposed to mortgage rate moves.
Tier 4 · Mainstream Housing Market (San Jose / San Mateo / Redwood City)
The Bay Area's volume engine. San Jose: 631 closings (~22% of three-county total), $1.74M median, cash 19.0%, sale/orig 106.8%, DOM 7 — at Q1's 6.83% rate level, San Jose buyers still closed 6-7% above list. San Mateo: 74 closings, $2.00M median, cash 27.0%, sale/orig 108.5%, DOM 10. Redwood City: 63 closings, $2.41M median, cash 23.8%, sale/orig 108.7%, DOM 9. This tier generally ran sale/orig 106–109% in Q1.
Tier 5 · East Bay Extension (Oakland / Berkeley / Hayward / Pleasanton / Livermore / Alameda)
Widest internal spread of any tier. Berkeley Q1: $1.56M median, sale-to-original 118.7% — the highest of any Bay Area city in Q1 (35.1% cash share also elevated, driven by concentrated ZIP-level over-bidding). Alameda: $1.43M, 112.7%. Oakland: $1.01M median, 323 closings (No. 2 by volume), 106.4%. Hayward: $940K, 102.7%. Pleasanton: $1.82M, 100.0% (below list — the East Bay's weakest Q1 read). Livermore: $1.27M, 103.2%. Berkeley's 118.7% and Pleasanton's 100.0% coexist within one Q1 regional grouping.
Tier 6 · Coastal / Outer Suburbs (Daly City / Pacifica / Half Moon Bay / Gilroy / Morgan Hill / Castro Valley)
Median $1.20M–$1.53M, DOM 8–13 days, cash share 14–27%. Most directly affected by mortgage rates — mortgage buyers dominate, and sensitivity to macro rate and HPI moves is much higher than in the other five tiers. Daly City Q1: 54 closings, $1.23M median, sale/orig 111.0%. Pacifica: 30 closings, $1.38M, 106.7%. Gilroy: 51 closings, $1.20M, 100.0%. Morgan Hill: 49 closings, $1.51M, 101.4%. Half Moon Bay: 11 closings, $1.53M, 102.6%. Castro Valley: 51 closings, $1.28M, 103.1%. Q1 over-bid intensity in the outer ring was notably softer than the core — this is where rate-rebound transmission was most direct.
| City | Closings | Median Sale | Cash % | DOM | Sale/Orig |
|---|---|---|---|---|---|
| San Jose | 631 | $1.74M | 19.0% | 7 | 106.8% |
| Oakland | 323 | $1.01M | 18.6% | 14 | 106.4% |
| Fremont | 132 | $1.79M | 13.6% | 8 | 107.4% |
| Livermore | 128 | $1.27M | 14.8% | 8 | 103.2% |
| Hayward | 80 | $940K | 15.0% | 12 | 102.7% |
| Berkeley | 77 | $1.56M | 35.1% | 13 | 118.7% |
| Santa Clara | 75 | $2.10M | 14.7% | 8 | 111.9% |
| San Mateo | 74 | $2.00M | 27.0% | 10 | 108.5% |
| Sunnyvale | 73 | $2.75M | 11.0% | 7 | 118.2% |
| Pleasanton | 72 | $1.82M | 16.7% | 8 | 100.0% |
| Palo Alto | 66 | $4.24M | 33.3% | 7 | 108.9% |
| Redwood City | 63 | $2.41M | 23.8% | 9 | 108.7% |
| San Leandro | 62 | $865K | 21.0% | 11 | 102.5% |
| Dublin | 58 | $1.59M | 5.2% | 7 | 104.0% |
| Alameda | 55 | $1.43M | 23.6% | 13 | 112.7% |
| Los Altos | 37 | $5.70M | 45.9% | 8 | 108.1% |
| Menlo Park | 36 | $3.57M | 41.7% | 8 | 106.2% |
| Saratoga | 35 | $4.15M | 22.9% | 7 | 103.9% |
| Cupertino | 39 | $3.69M | 25.6% | 7 | 113.0% |
| Atherton | 15 | $8.20M | 86.7% | 10 | 99.4% |
Source: MLSListings + Bay East / Contra Costa AOR Q1 2025 · cities with ≥3 Q1 closings (~50 cities total) · MK Group internal observations supplement Tier 1 off-market activity.
7. Takeaways for Sellers, Buyers, and Cross-Border Investors
7.1 For sellers
- $1.5M-$5M school-zone: Q1 was one of 2025's tightest sell windows. $1.5M-$3M sale/orig 108.0%, DOM 8 days; $3M-$5M sale/orig 108.6%, DOM 7 days. Sellers in this band generally closed 6-9% above original list in Q1 — meaning a list-near-comps strategy could secure meaningful premium. If 2025 sale is the plan, the Q1 spring window's tightness exceeded any other quarter of the year.
- Avoid "list-high test the water" in $5M+. Q1's $20M+ band closed at median sale/orig of just 90.7% with median DOM 79.5 days — and 323 Walsh RD ran 273 days with a 14.9% cut. List prices in $5M+ should sit close to recent comps with 5-8% negotiating room; padding of 20-30% buys roughly nine months of market time and a large eventual concession.
- Watch the counterintuitive "macro headwind + micro over-bidding" dynamic. Q1 was the quarter of rate rebound and equity correction, yet mid-tier school-zone closed at 108% sale-to-original. If buyers cite "macro unfriendliness" to negotiate down, the data response is clear — core school-zone spring over-bidding behavior decouples from the macro cycle on a quarterly basis.
7.2 For buyers
- $10M+ seller concession was a confirmed Q1 signal. $20M+ median sale/orig 90.7%, median DOM 79.5 days — meaning offers 10-15% below list have real success potential, especially on properties listed more than 90 days. 323 Walsh RD's path from $23.5M list to $20.0M close shows that ultra-luxury negotiating room in Q1 was structural, not case-by-case.
- Premium school cores ($3M-$5M) required 6-9% over-bidding in Q1. Palo Alto, Los Altos, Menlo Park, Saratoga, and Cupertino ran quarterly sale/orig 106-113% with DOM 7-8 days — supply tightness that rate rebound and equity correction couldn't dent. Buyers in this band need pre-approval + capital in place + rapid decisions, not macro-watching.
- Off-market relationship infrastructure beats MLS searching in $5M+. Q1 public MLS captured 130 closings across the $5M+ tiers (115 + 13 + 2); true volume is likely meaningfully higher. Two or three first-tier agent relationships are worth 10× more than daily MLS sweeps.
7.3 For cross-border investors and researchers
- Q1 cash advantage in $5M-$10M is the strongest differentiation window. $5M-$10M cash share is 53.9% — a cash close competes with half the field on equal terms. But $10M+ cash 77-100% — cash is baseline rather than differentiator; cross-border investors in this tier must compete on speed + off-market relationship access.
- Trust / LLC ownership structures should be finalized before any offer. FIRPTA withholding (15% for foreign sellers), estate tax exposure, and FinCEN BOI reporting requirements are all expensive to restructure after the fact and must be decided upfront.
- For researchers: Q1 is the canonical specimen quarter for "macro headwind vs micro over-bidding" decoupling. The 30-year fixed at 6.83% rebound, S&P 500 down 4.59%, and $1.5M-$5M sale-to-original at 108% all coexisting means that describing Bay Area core school-zone housing by macro rates or equity indices has become distorted.
⚠️ This section's tax and legal content is general information only, not professional advice. Consult a qualified tax attorney or CPA for your specific situation.
8. Methodology and Definitions
Data source
This report's core data is from MLSListings (covering Santa Clara, San Mateo, Santa Cruz, and Monterey counties) and Bay East / Contra Costa AOR (covering Alameda and Contra Costa). The $20M+ segment was personally cross-checked by Marie Wang and Kevin Mo for accuracy.
Coverage scope
This Q1 2025 issue focuses on the three core counties of San Mateo + Santa Clara + Alameda — the most active Bay Area real estate counties and the geography MK Group serves most densely. The remaining six counties (San Francisco / Marin / Contra Costa / Sonoma / Napa / Solano) are not included in this issue.
Time window
- Q1 primary data: CloseDate ∈ [2025-01-01, 2025-03-31], 2,902 closings
- This issue does not include a QTD (quarter-to-date) chapter — only strictly in-quarter data is reported
Property type
Single Family Residential (SFR) only. Excludes condos, multi-family, and land.
Cash transaction definition
Records with the MLSListings "Buyer Financing" field (Bay East labels this "SoldTerms") equal to "All Cash No Loans" or "Cash to Existing Loan" are classified as cash. Other values are classified as non-cash.
Price band definition
Bands are defined by actual Sale Price (not List Price). All medians shown are standard statistical median (not mean).
Exclusion rules
- Status of Cancelled, Expired, or Withdrawn — excluded
- Sale Price below $100,000 — excluded (highly likely to be family / trust / divorce transfer)
Known limitations
- Excludes pure off-market transactions that never entered MLS. Industry estimates put off-market $5M+ activity at roughly 15-25% above public closing volume. The "2 closings" figure for $20M+ refers to MLS-recorded transactions only; true volume is likely 50-100% higher.
- This issue is published as part of the 2025 series backfill; the YoY comparison relies on FRED macroeconomic indicators; a per-closing 2024 Q1 export is not included in this issue.
- School-zone-level segmentation is not in this issue; it will be added as a new section in a subsequent report.
9. About MK Group
MK Group (Meridian Keystone Real Estate Group) is a Cupertino-based Bay Area real estate team co-founded by Marie Wang (DRE# 02110980) and Kevin Mo (DRE# 02127623), operating with Keller Williams Realty.
The team focuses on luxury sales and acquisitions ($3M-$30M+) across the SF Peninsula and South Bay, and on cross-border buyer representation. MK Group is one of the few Bay Area teams with depth in both English mainstream-market service and native bilingual Mandarin service — combined YouTube subscriber base of 68K+ across two channels.
About the MK Bay Area Pulse series
Pulse is MK Group's quarterly Bay Area market intelligence report, drawing on complete MLS closing data plus County Recorder verification plus the firm's internal observations from 200+ served families. Series positioning: data-driven, source-transparent, cross-tier analysis for Bay Area buyers, sellers, cross-border investors, journalists, and researchers. Published quarterly.
Citation
Wang, M., & Mo, K. (2025). MK Bay Area Pulse 2025-Q1. Meridian Keystone Real Estate Group. https://mkbayarea.com/en/pulse/2025-q1
For high-resolution chart files, complete datasets, or press inquiries, contact Marie Wang(marie.wang@kw.com) or Kevin Mo(kevin.mo@kw.com), or via mkbayarea.com/contact
2025 series
This is the first issue of the 2025 series, published as a 2025 series backfill. Other quarterly reports are archived at mkbayarea.com/pulse.
Questions about your specific situation?
Data provides context — your decision depends on your timeline, budget, and goals. Reach out to Marie Wang or Kevin Mo directly. First consultation is always free and carries no obligation.