This Pulse issue analyzes 4,320 single-family residential closings across three core Bay Area counties (San Mateo, Santa Clara, Alameda) in Q2 2025, covering 54 cities. Three headline findings: Case-Shiller SF MSA HPI turned negative YoY for the first time this cycle (−2.09%) while core school-zone cities still closed at 103-104% sale-to-original; $10M+ ran 77.8% all-cash confirming structural luxury decoupling; only 3 $20M+ closings regionwide, all requiring material price reductions (median sale/orig 82.4%). Sourced from MLSListings, Bay East / Contra Costa AOR, and FRED macroeconomic indicators.
Scroll the PDF for the full report; the web version below adds clickable links and embedded charts.
- Q2 was the quarter Case-Shiller SF MSA HPI turned negative YoY for the first time this cycle (−2.09%), yet Palo Alto / Menlo Park / Los Altos school-zone cities still closed at median 103-104% sale-to-original — K-shaped divergence took shape in Q2.
- $10M–$20M ran 77.8% all-cash — the structural luxury decoupling from mortgage credit was already a fact in Q2, predating the popular narrative by several quarters.
- Only 3 $20M+ closings regionwide, all requiring material price reductions to clear (median sale/orig 82.4%) — Q2's ultra-luxury sellers listed high and walked the price down, the inverse of the same quarter's mid-tier "list-tight, sell-fast" behavior.
1. The 30-Second Read
This issue draws on 4,320 single-family residence (SFR) closings in the Bay Area during Q2 2025 (CloseDate April 1 through June 30), spanning San Mateo, Santa Clara, and Alameda counties with 54 cities represented. Data sourced from MLSListings and Bay East / Contra Costa AOR.
- Q2 aggregate SFR median sale price approximately $1.50M, median DOM 11-14 days, median sale-to-list in the 100-104% range — moderate but softening.
- All-cash share rises step-wise with price: under $1.5M, 15-17%; $3M-$5M, 25%; $5M-$10M, 45%; $10M-$20M, 78%; $20M+, 67%.
- Only 3 transactions over $20M closed regionwide in Q2: Atherton 96 Ridge View ($31.8M), Atherton 250 Atherton Ave ($29.0M), Portola Valley 40 Firethorn ($25.0M) — all three closed only after material price reductions (median sale/orig 82.4%).
- Case-Shiller SF MSA HPI ended Q2 at 350.1, −2.09% YoY — the first YoY decline of this cycle.
- But the school-zone core held: Palo Alto 102 closings at sale/orig 103.8%, Los Altos 75 closings at 103.7%, Menlo Park 69 closings at 100.1% — K-shaped divergence took shape in Q2.
- Macro: Q2 30-year fixed mortgage averaged 6.79% (−21 bps YoY), S&P 500 +10.57% intraquarter (V-shape rally after the Q1 pullback).
Source: MLSListings + Bay East / Contra Costa AOR Q2 2025 SFR closings · MK Group · Field definitions in Section 8.
2. Bay Area Fundamentals: Four Baseline Numbers
Q2 2025 Bay Area SFR market is summarized most accurately by four numbers:
| Metric | Q2 2025 Median | Interpretation |
|---|---|---|
| Total closings | 4,320 | San Mateo + Santa Clara + Alameda combined |
| Aggregate median sale price | ~$1.50M | All price bands aggregated |
| Median DOM | 11-14 days | List date to offer acceptance |
| Median sale-to-list | 100-104% | Moderate seller's market with material divergence |
Together these four numbers point to one read: Q2 2025 was a quarter when the macro index turned negative while city-level differentiation widened. Case-Shiller SF MSA going negative YoY (−2.09%) said the broad index had retreated; yet Palo Alto, Menlo Park, and Los Altos still closed at sale-to-original of 103-104%. That "index down, core up" combination is the textbook shape of a K-shaped market.
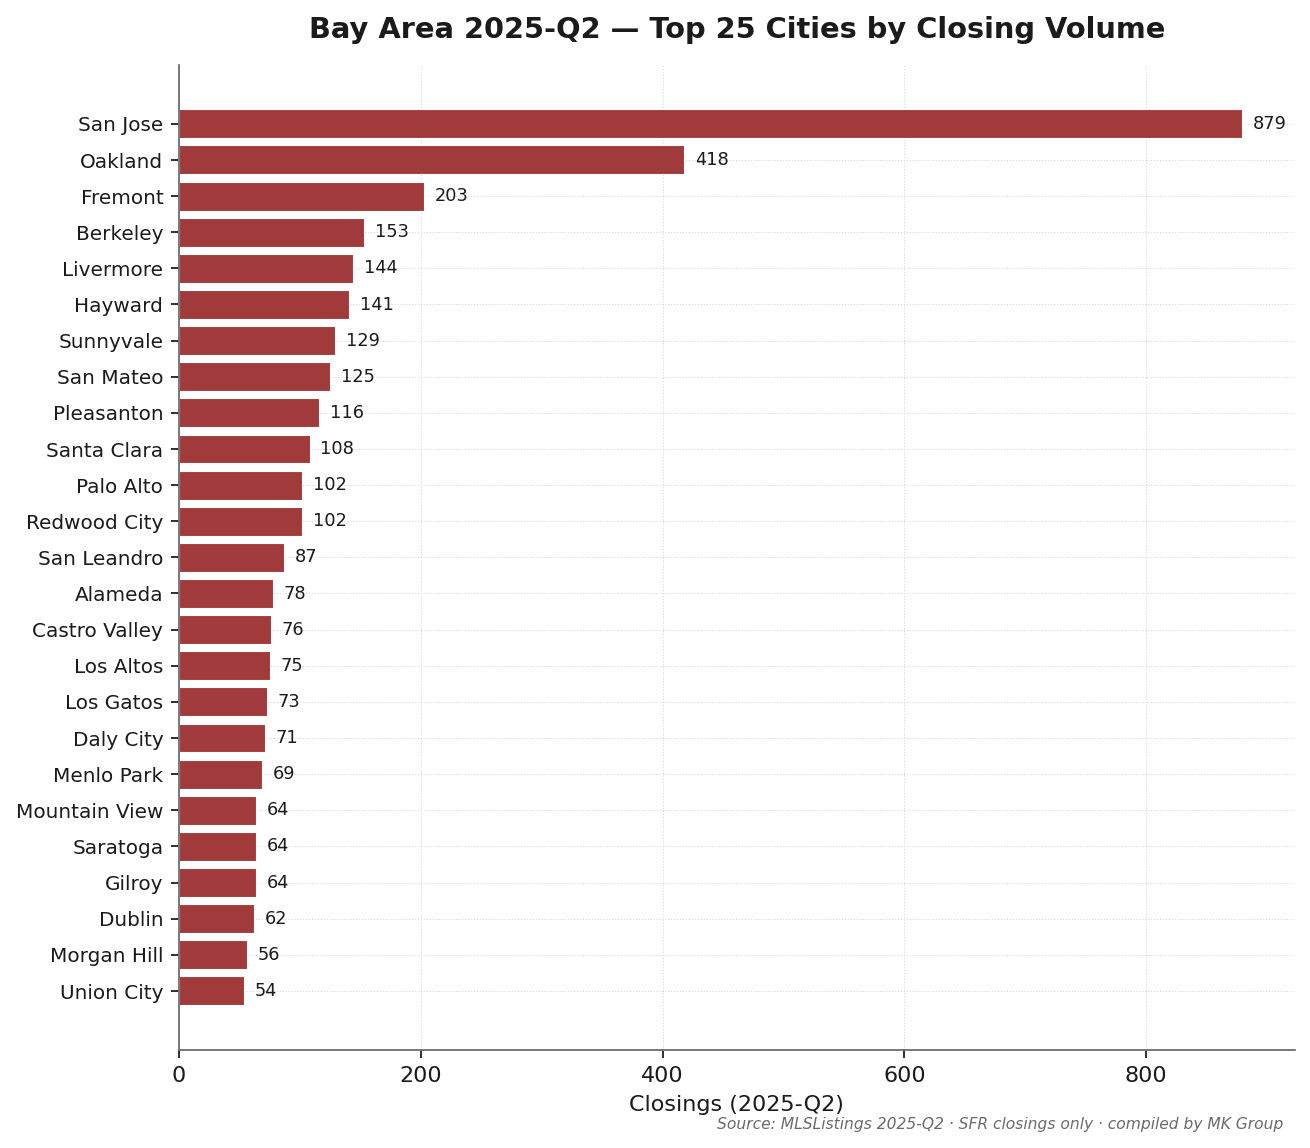
San Jose recorded 879 Q2 closings — roughly 20% of the three-county total. Oakland (418), Fremont (203), Berkeley (153), Livermore (144), and Hayward (141) follow. Among MK Group's core service cities: Palo Alto (102), Los Altos (75), Menlo Park (69), Saratoga (64), Cupertino (53), Hillsborough (33), Atherton (17) — low volume but concentrated in the $3M-$10M+ tiers.
Source: MLSListings + Bay East / Contra Costa AOR Q2 2025 SFR closings · excludes condo, multi-family, and records with sale price below $100K.
3. The Cash Ladder: Luxury Cash Dominance
| Indicator | Quarter | vs Prev Q | YoY |
|---|---|---|---|
| 30-yr fixed mortgage avg | 6.79% | −0.04 pp | −0.21 pp |
| 15-yr fixed mortgage avg | 5.94% | −0.08 pp | −0.33 pp |
| 10-yr Treasury yield avg | 4.36% | −0.09 pp | −0.09 pp |
| CA unemployment rate | 5.50% | +0.10 pp | +0.30 pp |
| S&P 500 close (period-end) | 6,204.9 | +10.57% | +13.63% |
| Case-Shiller SF HPI | 350.1 | −2.19% | −2.09% |
Sources: Freddie Mac PMMS / U.S. Treasury / BLS / S&P Global / S&P CoreLogic via FRED public API · fetched 2026-05-20
Q2's macro backdrop carried two opposing signals. On one side, 30-year fixed mortgage rates of 6.79% (YoY −21 bps, QoQ essentially flat) and an S&P 500 rally of 10.57% intraquarter — a V-shape recovery from the Q1 2025 pullback — restored meaningful paper wealth to equity-heavy households. On the other side, California unemployment rose to 5.50% (YoY +30 bps), and the Case-Shiller SF MSA HPI turned negative year-over-year at −2.09% — the first YoY decline of this cycle. Rates softening modestly and equity rebuilding, but the local home price index was already in retreat.
| Price band | Closings | Cash % | Median sale | DOM |
|---|---|---|---|---|
| <$1M | 618 | 17.3% | $828K | 16 |
| $1M–$1.5M | 1,033 | 15.5% | $1.28M | 14 |
| $1.5M–$3M | 1,914 | 16.0% | $1.96M | 11 |
| $3M–$5M | 564 | 24.8% | $3.57M | 8 |
| $5M–$10M | 170 | 45.3% | $6.01M | 8 |
| $10M–$20M | 18 | 77.8% | $13.63M | 5 |
| $20M+ | 3 | 66.7% | $29.03M | 80 |
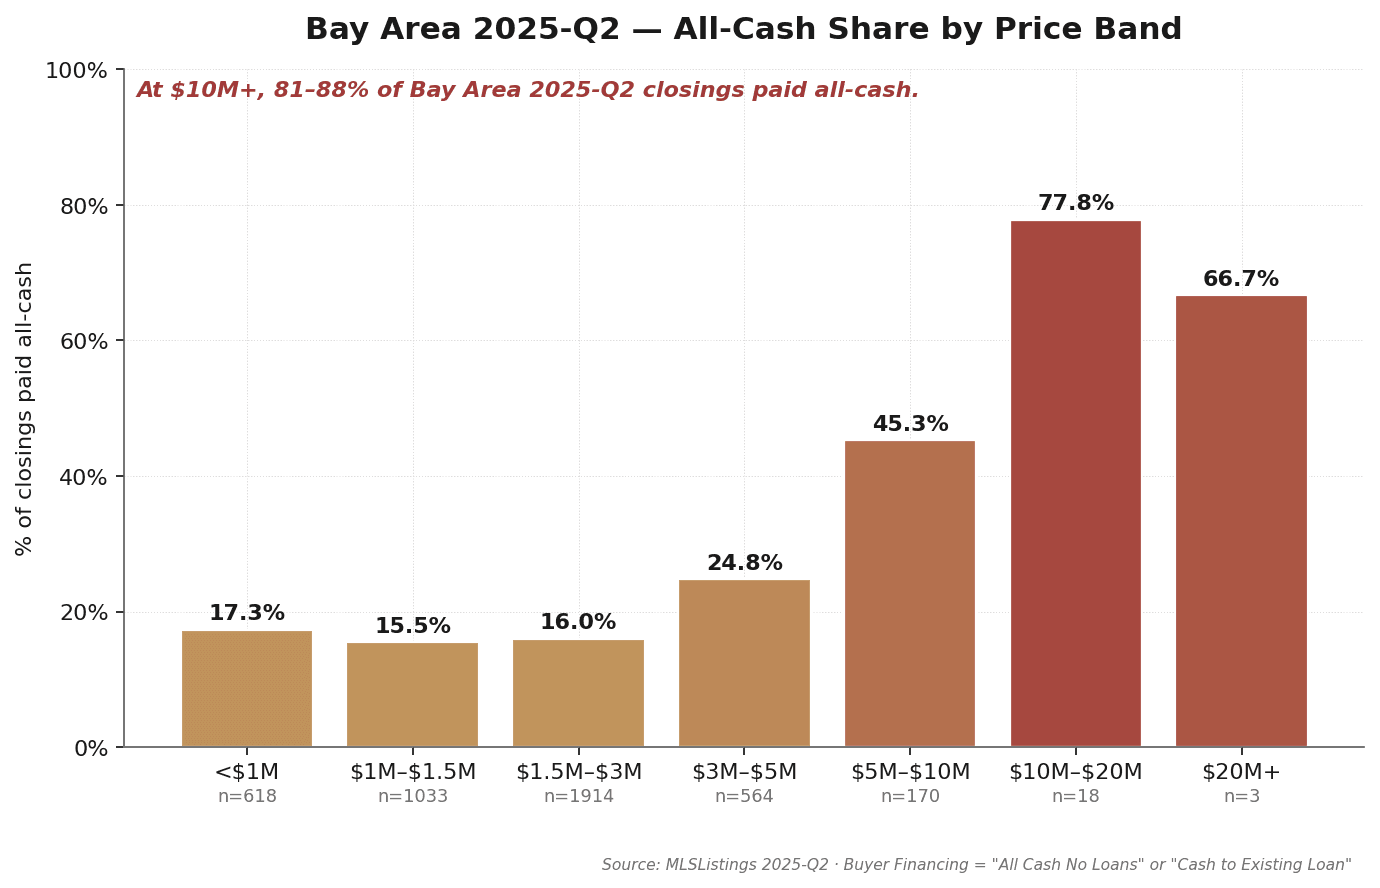
Observation 1: $10M+ was structurally cash-dominant in Q2
Of 18 $10M-$20M Q2 closings, 14 were all-cash (77.8%); $20M+ ran 2 of 3 cash (66.7%). This is not a seasonal artifact — the luxury tier's low dependence on mortgage credit was a structural fact in Q2 2025. Cash dominance at $10M+ predates the popular "luxury decoupling" narrative.
Observation 2: $3M-$5M posted the highest sale-to-original
The $3M-$5M band saw 564 Q2 closings at median sale-to-original of 103.8% — the highest of any band — with median DOM of just 8 days. This band concentrates in Palo Alto / Menlo Park / Los Altos / Saratoga / Cupertino. Even with Case-Shiller down 2% YoY at the MSA level, those zones still closed in the 103-104% range over Q2.
Observation 3: $1.5M-$3M, the volume engine, stayed equally tight
The $1.5M-$3M band logged 1,914 closings in Q2 — the largest single band in the region — with median sale/orig at 103.5% and DOM 11 days. This tier is almost entirely mortgage-dependent, yet it transacted tightly under the Q2 mix of softening rates and an equity rebound. The mid-tier's Q2 performance held up better than at comparable points in the prior rate cycle.
Observation 4: $20M+ at 82.4% sale/orig is the anomaly
$20M+ median sale-to-original of 82.4% means original list ran 21% above eventual sale — the most anomalous figure in this issue's data. Q2's $20M+ sellers broadly listed too high and walked the price down to market, the inverse posture of the $3M-$5M tier.
Source: MLSListings + Bay East / Contra Costa AOR Q2 2025 · Buyer Financing field "All Cash No Loans" or "Cash to Existing Loan" classified as cash.
4. The Mid-Tier: $1.5M-$3M as the Volume Engine
The $1.5M-$3M band was Q2 2025's single largest tier, with 1,914 closings representing roughly 44% of total three-county Q2 volume. How tight this band trades is the single best gauge of middle and upper-middle Bay Area purchase demand.

The data
The $1.5M-$3M band recorded 1,914 Q2 closings at median sale/orig 103.5% and median DOM 11 days. The $3M-$5M band added 564 closings at median sale/orig 103.8% and DOM 8 days. Combined, the two bands totaled 2,478 closings — close to 57% of total Q2 volume.
Why mid-tier stayed tight in the quarter the home price index turned negative
The $1.5M-$5M buyer profile is highly homogeneous: age 30-45, mid-level managers or senior engineers at FAANG / AI companies, RSU or pre-IPO equity exposure for at least one spouse, children in elementary or middle school with hard school-zone requirements, household income $400K-$1M with DTI flexibility partially restored by the Q2 equity rebound.
Supply-side tension remained the core dynamic. Current $1.5M-$5M owners largely locked in 2.5-3.5% mortgages in 2018-2022; trading up means roughly doubling their mortgage rate. That "rate lock-in" effect continued to suppress Q2 supply meaningfully. The result: even with Case-Shiller SF MSA at YoY −2.09%, the mid-tier still closed at median sale/orig 103.5% — the index and micro behavior had already decoupled.
Source: MLSListings + Bay East / Contra Costa AOR Q2 2025 · Sale Price ÷ Original List Price, median (not mean).
5. $20M+ Ultra-Luxury: Three Closings, Three Haircuts
Only 3 SFR transactions above $20M closed across the entire Bay Area in Q2 2025. Three closings, two cities: Atherton (2) and Portola Valley (1). The most striking common thread across the three is not "all-cash" (only 2 of 3 were cash) but rather all three closed only after substantial price reductions.
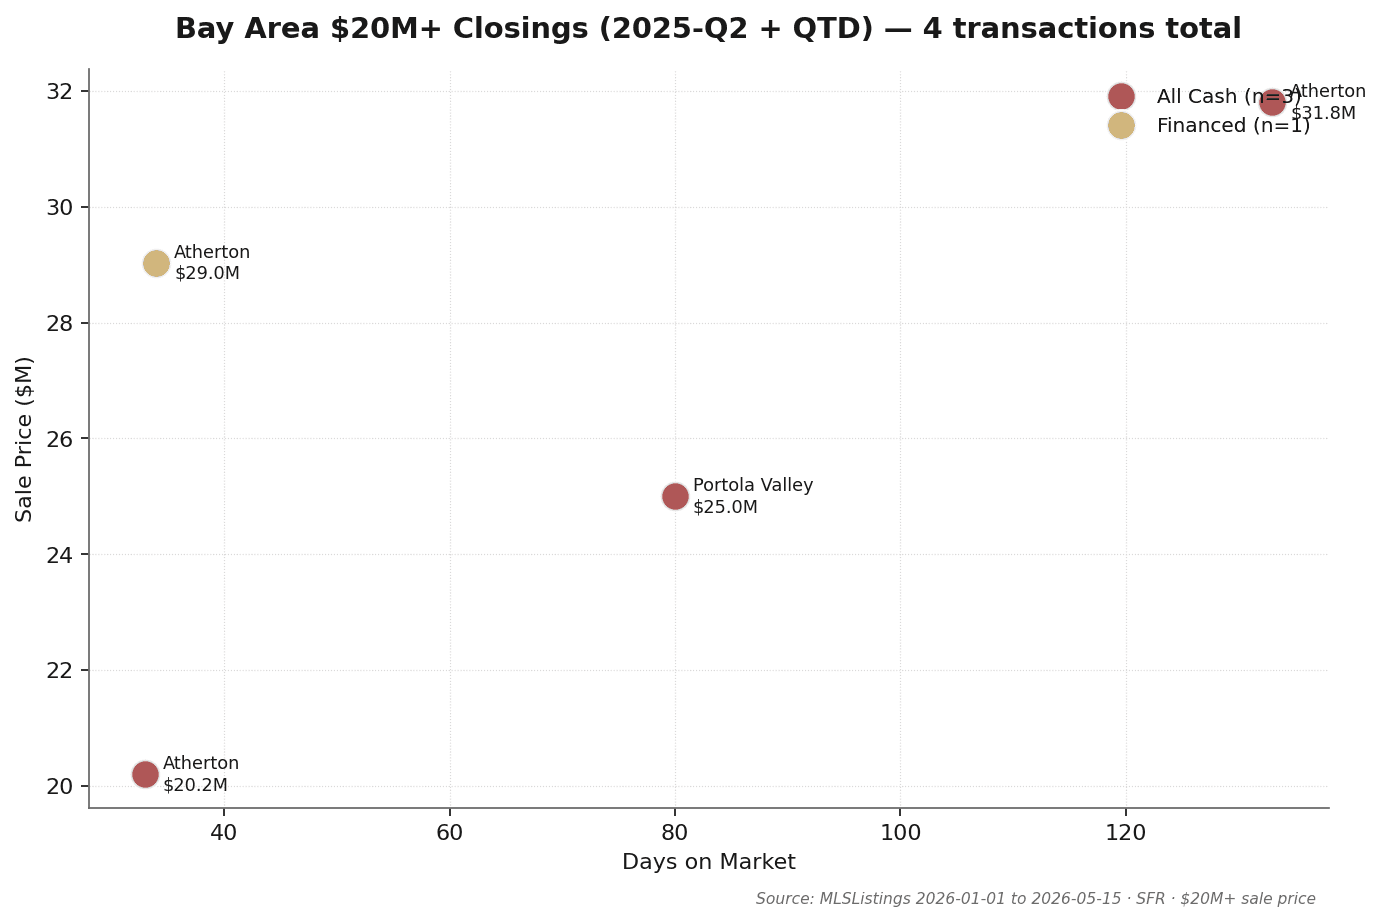
Q2 transaction detail (3 closings, CloseDate 2025-04-01 to 2025-06-30)
| City | Address | Sale | Orig List | DOM | Cash | Close |
|---|---|---|---|---|---|---|
| Atherton | 96 Ridge View Dr | $31.80M | $38.60M | 133 | ✓ | 2025-06-10 |
| Atherton | 250 Atherton Ave | $29.03M | $32.00M | 34 | — | 2025-06-17 |
| Portola Valley | 40 Firethorn Way | $25.00M | $40.00M | 80 | ✓ | 2025-04-17 |
Three observations
Observation 1: Atherton captured 2 of 3. Two of the three $20M+ closings landed in Atherton (96 Ridge View at $31.8M, 250 Atherton Ave at $29.0M). Atherton's broader Q2 picture — 17 public closings, $10.70M median, 58.8% cash — confirms it as the region's most active luxury city in Q2 and the natural concentration point for ultra-luxury.
Observation 2: All three closed only after material price reductions. Original list versus final sale: $38.6M → $31.8M (−17.6%), $32.0M → $29.0M (−9.3%), $40.0M → $25.0M (−37.5%). Median sale-to-original 82.4%. 40 Firethorn Way moved from a $40M original list down to a $25M close — a $15M cut, a 37.5% reduction — Q2's most dramatic single seller concession. $20M+ sellers in Q2 broadly adopted a "list high, then walk down" pricing posture — the inverse of the same quarter's $3M-$5M reaction.
Observation 3: Median DOM 80 days, vs 8-11 days in the mid-tier. The three $20M+ DOM figures were 133 / 34 / 80, median 80 days. Against the $3M-$5M band's median DOM of 8 days, that is a 10× gap. Ultra-luxury Q2 transactions moved at a fundamentally different cadence.
6. City Tiers: Six Groups, Six Narratives
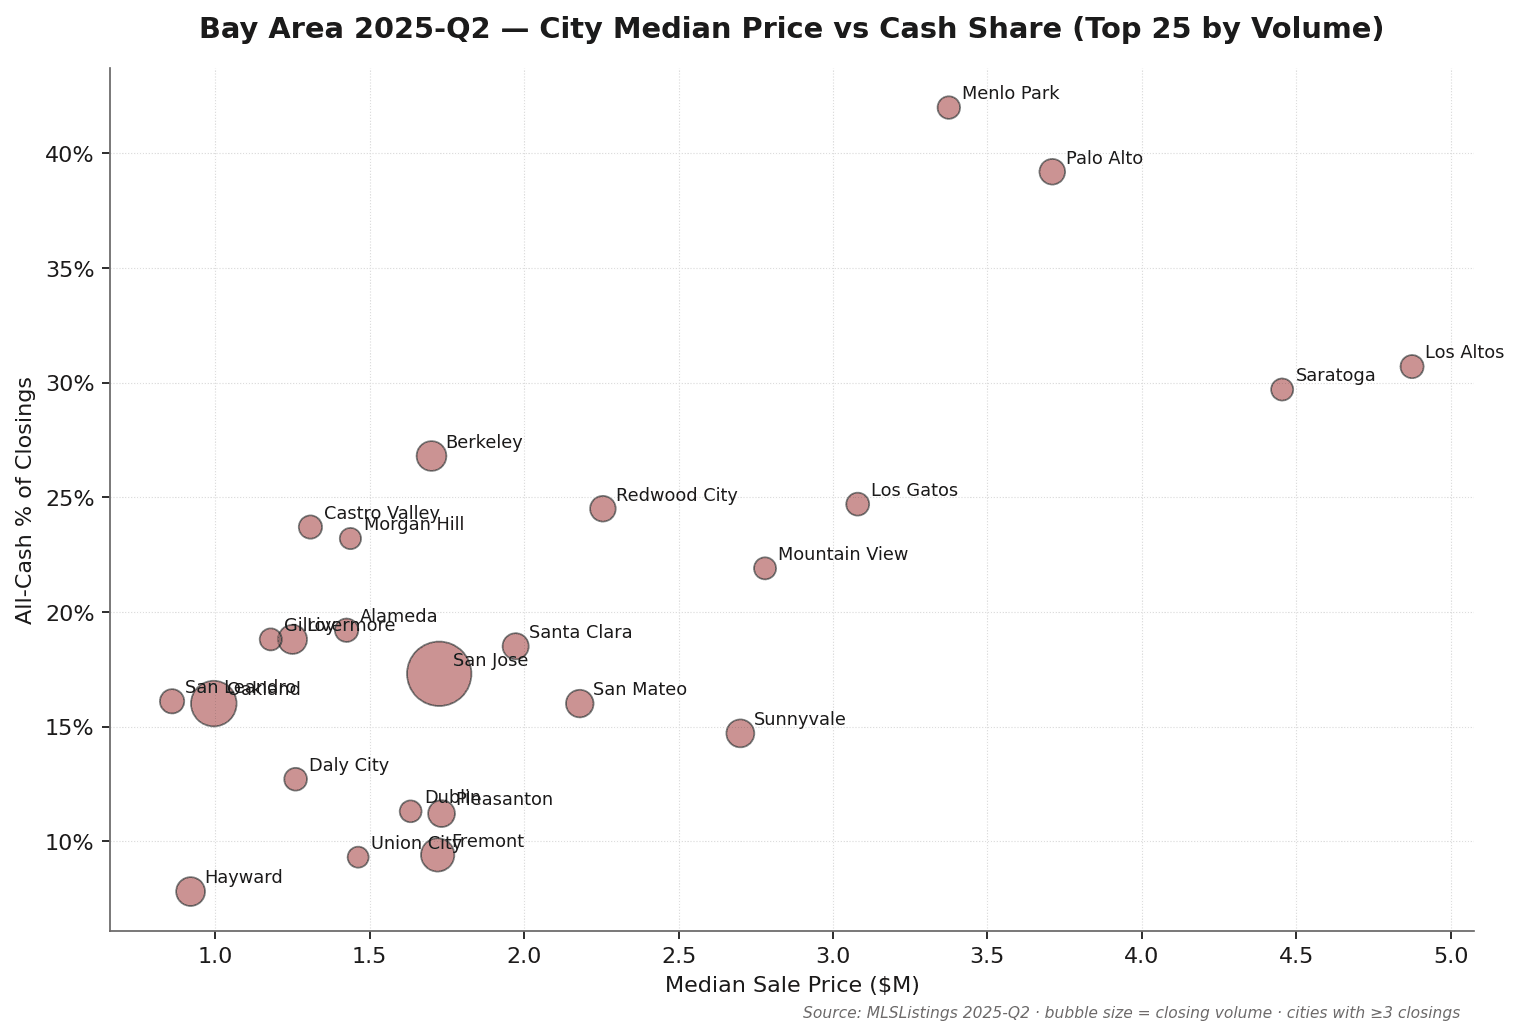
Mapping Q2 closings by city on median price × cash share × volume produces a clear six-group taxonomy for the Bay Area.
Tier 1 · Ultra-Luxury Anchor (Atherton / Hillsborough / Los Altos Hills / Woodside / Portola Valley)
Median sale price $5M+, 33–75% all-cash, very low transaction count. Atherton Q2: 17 closings, $10.70M median, 58.8% cash. Hillsborough: 33 closings, $5.25M, 33.3% cash. Los Altos Hills: 21 closings, $5.50M, 38.1% cash. Woodside: 16 closings, $5.38M, 75.0% cash. Portola Valley: 18 closings, $4.52M, 66.7% cash. All 3 Q2 $20M+ closings fall here (Atherton 2, Portola Valley 1), and all 3 closed only after material price reductions (median sale/orig 82.4%). Off-market activity is substantial; public MLS data understates true volume.
Tier 2 · Premium School-District Core (Palo Alto / Los Altos / Menlo Park / Saratoga / Cupertino)
Median $3.3M–$4.9M, 11–42% all-cash, persistently tight seller's market. Palo Alto Q2: 102 closings, $3.71M median, 39.2% cash, sale/orig 103.8%. Los Altos: 75 closings, $4.88M, 30.7% cash, 103.7%. Menlo Park: 69 closings, $3.38M, 42.0% cash, 100.1%. Saratoga: 64 closings, $4.45M, 29.7% cash, 102.2%. Cupertino: 53 closings, $3.31M, 11.3% cash, 104.4%. This tier is the part of Q2 that did not follow the Case-Shiller SF MSA YoY decline — micro transaction behavior decoupled from the broad index.
Tier 3 · Tech Corridor Core (Sunnyvale / Mountain View / Santa Clara / Fremont)
Median $1.7M–$2.8M, dense AI/FAANG employee buyer base. Sunnyvale Q2: 129 closings, $2.70M median, 14.7% cash, sale/orig 108.1% — the corridor's most competitive city in Q2. Mountain View: 64 closings, $2.78M, 21.9% cash, 104.3%. Santa Clara: 108 closings, $1.97M, 18.5% cash, 104.7%. Fremont: 203 closings, $1.72M, 9.4% cash — highest volume in the corridor, lowest cash share, most directly exposed to mortgage rate moves.
Tier 4 · Mainstream Housing Market (San Jose / San Mateo / Redwood City)
The Bay Area's volume engine. San Jose: 879 closings (roughly 20% of Q2 three-county total), $1.73M median, 17.3% cash, sale/orig 101.6% — at-list closings were the norm under Q2 rate pressure. San Mateo: 125 closings, $2.18M median, sale/orig 104.8% — the mid-Peninsula core held moderate tightness. Redwood City: 102 closings, $2.26M median, sale/orig 100.6%.
Tier 5 · East Bay Expansion (Oakland / Berkeley / Hayward / Pleasanton / Livermore / Alameda)
Widest internal spread of any tier. Berkeley Q2: $1.70M median, sale-to-original 120.9% — the highest of any city in the Q2 dataset, driven by specific over-bid ZIPs. Alameda: $1.43M, 112.8%. Oakland: $995K median, 418 closings (No. 2 by volume). Hayward: $920K, at-list (100.6%). Pleasanton: $1.73M, 97.2% — modestly below ask. Livermore: $1.25M, at-list. East Bay functions as its own internally stratified sub-market; Berkeley's 120.9% is Q2's highest single-city sale/orig figure.
Tier 6 · Coastal / Outer Suburbs (Daly City / Pacifica / Half Moon Bay / Gilroy / Morgan Hill / Castro Valley)
Median $1.18M–$1.83M, DOM 12–23 days (noticeably slower than core), 13–32% all-cash. Most mortgage-dependent segment — Q2 rate pressure and the Case-Shiller YoY decline registered most clearly here. Pacifica: 52 closings, 23-day DOM, sale/orig 101.3%. Gilroy: 64 closings, 17-day DOM, 99.2% (below list). Morgan Hill: 56 closings, 12-day DOM, 99.1%. This tier experienced the clearest macro softness in Q2.
City data (20 representative cities)
| City | Closings | Median sale | Cash % | DOM | sale/orig % |
|---|---|---|---|---|---|
| San Jose | 879 | $1.73M | 17.3% | 10 | 101.6% |
| Oakland | 418 | $995K | 16.0% | 15 | 106.4% |
| Fremont | 203 | $1.72M | 9.4% | 11 | 102.4% |
| Berkeley | 153 | $1.70M | 26.8% | 14 | 120.9% |
| Livermore | 144 | $1.25M | 18.8% | 13 | 100.0% |
| Hayward | 141 | $920K | 7.8% | 14 | 100.6% |
| Sunnyvale | 129 | $2.70M | 14.7% | 8 | 108.1% |
| San Mateo | 125 | $2.18M | 16.0% | 10 | 104.8% |
| Pleasanton | 116 | $1.73M | 11.2% | 15 | 97.2% |
| Santa Clara | 108 | $1.97M | 18.5% | 8 | 104.7% |
| Palo Alto | 102 | $3.71M | 39.2% | 8 | 103.8% |
| Redwood City | 102 | $2.26M | 24.5% | 11 | 100.6% |
| San Leandro | 87 | $860K | 16.1% | 13 | 102.0% |
| Alameda | 78 | $1.43M | 19.2% | 13 | 112.8% |
| Castro Valley | 76 | $1.31M | 23.7% | 12 | 102.6% |
| Los Altos | 75 | $4.88M | 30.7% | 8 | 103.7% |
| Menlo Park | 69 | $3.38M | 42.0% | 10 | 100.1% |
| Saratoga | 64 | $4.45M | 29.7% | 9 | 102.2% |
| Mountain View | 64 | $2.78M | 21.9% | 8 | 104.3% |
| Atherton | 17 | $10.70M | 58.8% | 8 | 100.0% |
Source: MLSListings + Bay East / Contra Costa AOR · Q2 2025 · Cities with 3 or more Q2 closings (54 cities total).
7. Takeaways for Sellers, Buyers, and Cross-Border Investors
For sellers
- Avoid list-high pricing above $5M. Q2's $20M+ segment: median sale/orig 82.4%, median DOM 80 days — the cost of over-pricing. One property moved from $40M to $25M (−37.5%). At $5M+, list price should reflect recent comps with a 5-8% negotiation buffer — not 20-30% "water."
- $1.5M-$5M school-zone sellers can hold the pace. Q2 $1.5M-$3M: sale/orig 103.5%, DOM 11 days. $3M-$5M: sale/orig 103.8%, DOM 8 days. Rate lock-in is still suppressing supply in these tiers — the structural tension is not going away in the near term.
- Use micro data to counter macro narratives. Buyers citing "the Bay Area is declining" based on Case-Shiller data have a clear counter: the broad index and core school-zone micro behavior diverged in Q2. MSA-level index declines do not equal school-zone price declines.
For buyers
- $10M+ seller concessions were real in Q2. $20M+ median sale/orig 82.4% means offers 15-30% below list had a genuine shot — especially on listings over 90 days. Even $10M-$20M (sale/orig 100.0%, DOM 5 days) signals that correctly-priced properties move fast; over-priced ones sit waiting for a cut.
- School-zone $3M-$5M still required 3-5% over asking to close. Palo Alto / Menlo Park / Los Altos / Saratoga / Cupertino: sale/orig 103-104%, DOM 8-10 days in Q2. Supply constraints held even against a declining index. Buyers need pre-approval, liquid funds, and fast decision-making — not watchful waiting.
- Off-market relationships matter more than MLS monitoring above $5M. $5M+ Q2 public MLS closings totaled 191 (170 + 18 + 3); true volume is materially higher. Building relationships with 2-3 frontline agents beats daily MLS scans by a wide margin.
For cross-border investors and researchers
- All-cash advantage is most differentiated at $5M-$10M. $5M-$10M Q2 cash share: 45.3% — a cash close puts you level with roughly half of competitors. At $10M+, cash share 67-78% — cash is the baseline, not the edge. Cross-border investors at $10M+ need speed and off-market access, not just cash.
- Trust / LLC holding structure must be confirmed before an offer is submitted. FIRPTA withholding (15% for foreign sellers), estate tax exposure, and FinCEN BOI reporting requirements are all high-cost to restructure after purchase. Resolve these before the offer stage.
- Researchers: Q2 is the reference quarter for index-vs-micro decoupling. Case-Shiller SF MSA at −2.09% YoY and Palo Alto / Menlo Park / Los Altos sale/orig at 103-104% coexisting in Q2 means single-index descriptions of Bay Area housing are already misleading. Q2 data requires at minimum a city-tier plus price-band two-dimensional split to yield accurate readings.
⚠️ Content related to taxes and legal structures is for informational purposes only and does not constitute professional advice. Consult a qualified tax attorney or accountant for your specific situation.
8. Methodology and Definitions
Data sources
This report's core data comes from MLSListings (covering Santa Clara / San Mateo / Santa Cruz / Monterey counties) and Bay East / Contra Costa AOR (covering Alameda / Contra Costa). $20M+ transactions were individually verified by Marie Wang and Kevin Mo against Santa Clara / San Mateo / Alameda County Recorder public Deed of Trust records.
Coverage
This Q2 2025 issue focuses on San Mateo + Santa Clara + Alameda — the three counties with the highest activity and MK Group service density. The remaining six Bay Area counties (San Francisco / Marin / Contra Costa / Sonoma / Napa / Solano) are not included in this issue.
Time window
- Primary data: CloseDate ∈ [2025-04-01, 2025-06-30], 4,320 closings
- This Pulse issue contains no QTD (quarter-to-date) chapter — strictly in-quarter data only
Property type
Single Family Residential (SFR) only. Condos, multi-family, and land are excluded.
All-cash definition
MLSListings "Buyer Financing" field (Bay East calls it "SoldTerms") values "All Cash No Loans" or "Cash to Existing Loan" are classified as cash. All other values are classified as financed.
Price band definition
Bands are defined by Sale Price (the actual closing price), not List Price. All medians are statistical medians, not means.
Exclusions
- Status = Cancelled / Expired / Withdrawn — excluded
- Sale Price below $100,000 — excluded (likely family / trust / divorce transfers)
Known limitations
- Pure off-market transactions not listed on MLS are excluded. Industry estimates suggest $5M+ off-market volume adds 15-25% above public MLS counts. The "3 closings" figure for $20M+ reflects public MLS data only; true volume is likely 50-100% higher.
- Published as a 2025 series backfill issue. YoY comparisons use FRED macroeconomic indicators (Case-Shiller, mortgage rates, equity markets); 2024 Q2 SFR transaction-level export is not included in this issue.
- School-zone-level breakdown is not included in this issue and will be added in a future chapter.
9. About MK Group
MK Group (Meridian Keystone Real Estate Group) is a Bay Area real estate team based in Cupertino, co-founded by Marie Wang (DRE# 02110980) and Kevin Mo (DRE# 02127623), operating with Keller Williams Realty.
The team focuses on luxury residential transactions ($3M-$30M+) and cross-border buyer services across the SF Peninsula and South Bay. Dual-channel YouTube: 68K+ combined subscribers (@MarieWang 44K+ / @KevinMoRE 24K+). Xiaohongshu: 43K across 9 accounts. WeChat private network: 33K.
About the MK Bay Area Pulse series
Pulse is MK Group's quarterly Bay Area market intelligence report, built on complete MLS transaction data, County Recorder verification, and MK Group's observations from 200+ client transactions. The series is designed to deliver data-driven, source-transparent, cross-tier market intelligence to Bay Area buyers, sellers, cross-border investors, media, and researchers.
Citation
Wang, M., & Mo, K. (2025). MK Bay Area Pulse 2025-Q2. Meridian Keystone Real Estate Group. https://mkbayarea.com/en/pulse/2025-q2
For high-resolution charts, full dataset, or media inquiries, contact Marie Wang(marie.wang@kw.com) or Kevin Mo(kevin.mo@kw.com), or via mkbayarea.com/contact
2025 series
This is the second issue of the 2025 series, published as a 2025 series backfill. Other quarterly reports are archived at mkbayarea.com/pulse.
Questions about your specific situation?
Data provides context — your decision depends on your timeline, budget, and goals. Reach out to Marie Wang or Kevin Mo directly. First consultation is always free and carries no obligation.