Direct answer
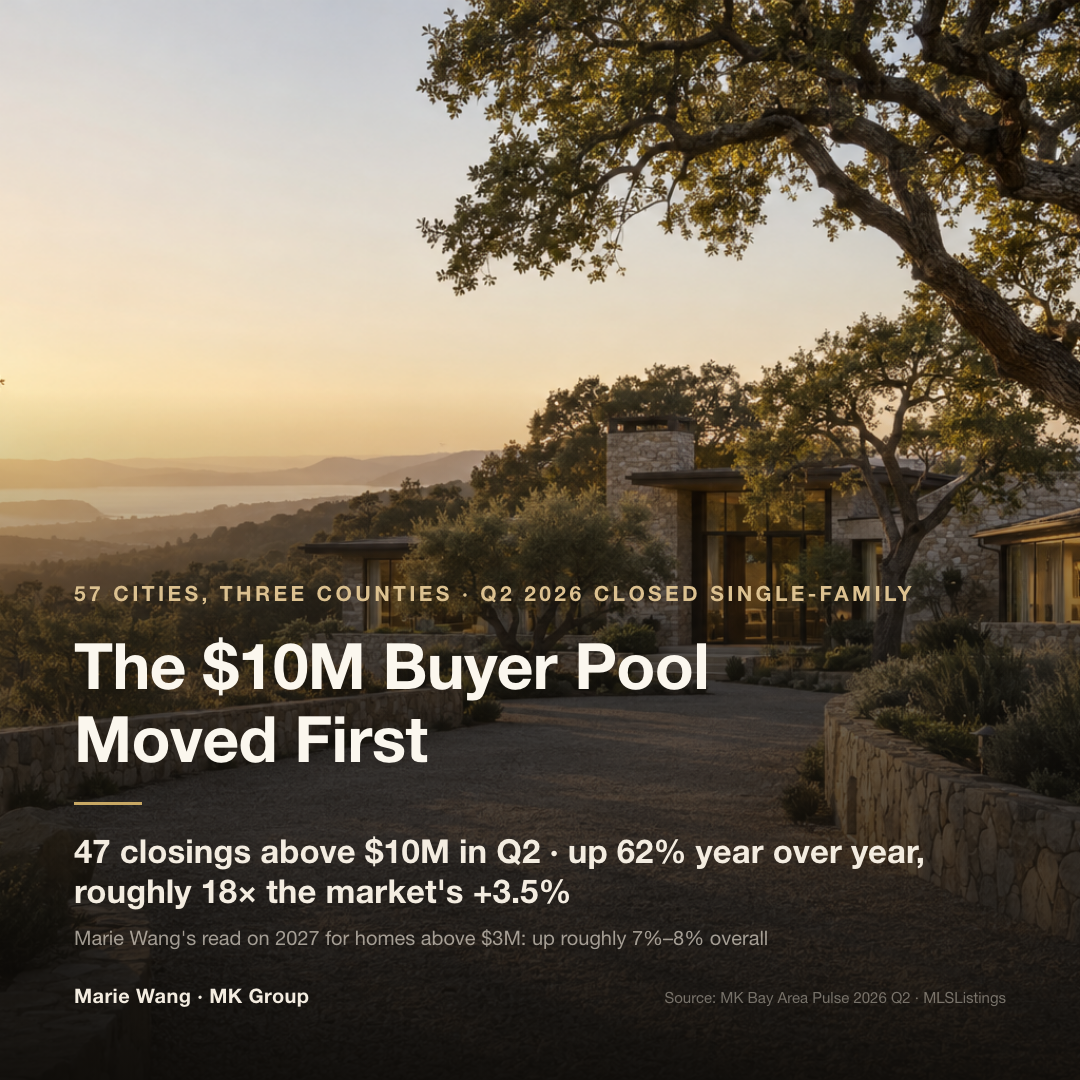
Marie Wang's answer is yes — at three different speeds. She reads 2027 as roughly 7%–8% overall for Silicon Valley homes above $3M: 5%–8% in the core cities at $3M–$5M, 8%–10% at $5M–$10M, and 10%–12% or more for genuinely scarce homes above $10M. Not every house rises.
Who this article is for
- Families planning to buy or trade up in Palo Alto, Los Altos, Menlo Park, Cupertino, Saratoga or Atherton in 2027, weighing "move this year" against "wait one more"
- Buyers with a $3M–$5M budget whose schools-and-space problem has a deadline attached
- Tech households at $5M–$10M sitting on freshly liquid equity and wanting to solve housing in one move
- Buyers entering the $10M+ tier who want to understand why it runs on a different clock than the broader market
- Owners of homes above $3M setting their 2027 listing window and pricing strategy
Three core dimensions
Dimension one: one rate locks demand — and locks supply harder
Thirty-year fixed rates sit a little above 6% today, with the strongest borrowers reaching into the 5s. The intuitive conclusion is that rates this high, layered onto continued tech layoffs, should hold prices down. Above $3M, the more consequential effect sits on the other side of the table.
Many owners still hold pandemic-era mortgages at 2.5%–3.5%. Selling that house and buying the next one at 6%-and-change nearly doubles the borrowing cost. Absent a reason they must move, they simply don't. High rates suppress demand and suppress supply in the same stroke — and the effect concentrates in exactly the places buyers want most: Palo Alto, Los Altos, Menlo Park, Cupertino, Saratoga, Atherton.
That is the counterintuitive part. Rates decide when buyers come back. Scarce supply decides what they pay once they do. And relief is not in the forecast: Fannie Mae's August 2026 outlook puts the 30-year fixed at 6.8% through the first half of 2027 and 6.7% for the year as a whole, while the Mortgage Bankers Association's August 2026 outlook sits near 6.7% for the year. Nobody credible is writing the script where rates fall off a cliff.
Dimension two: buyers already came back — you only see it once you split the bands
In Q2 2026, 57 cities across San Mateo, Santa Clara and Alameda counties closed 5,941 single-family homes. Volume rose 3.5% year over year, the median sale price rose 0.9%, and the median home went to contract in 12 days (full data in MK Bay Area Pulse 2026 Q2). Read alone, that is a mild market.
But those 5,941 closings run from well under $1M to above $20M, and "mild" is what you get when you average them. Isolate the homes above $3M and the picture changes completely. The $3M–$5M band closed 822 homes, up 10% year over year. The $5M–$10M band closed 279, up 26%. Above $10M, 47 homes closed against 29 in Q2 2025 — up 62%, roughly 18 times the market's 3.5%.
In all three bands, the growth shows up in volume before it shows up in price. The buyer pool widens first; bidding follows. Marie Wang's forecast rests on that sequence. The increase is not a prediction about 2027 — it is a process that started in 2026.
Dimension three: three bands, three different engines
$3M–$5M: locked supply pushes it up. Demand here is not a question of appetite. It is a question of deadline — a child starting school, a family that has outgrown the house, a commute that has become untenable. These households can postpone three months, or six. They cannot postpone indefinitely. Waiting accumulates demand; it does not accumulate homes in the core school attendance areas. Marie reads the core cities at 5%–8% for 2027.
$5M–$10M: trade-up demand plus AI wealth. Buyers in this band are not asking whether they want a bigger house. They are asking whether they are willing to solve the next decade in one move — better location, larger lot, real privacy, and no appetite for another renovation cycle. Cash accounted for 44.4% of Q2 closings here, which means more than half of these buyers still financed: salary, public equities, RSUs, private company stock and a mortgage all carrying part of the weight (related: the pre-IPO employee's Bay Area home plan). Citing the 2026 Silicon Valley Index from Joint Venture Silicon Valley, Marie notes that Silicon Valley drew roughly $92 billion of venture capital in 2025, of which about $80 billion — 83% — went to AI companies. Add a cohort with more buying power competing for the same short list of good houses and the price goes up. Her 2027 read: 8%–10% across the band, with homes where location, land, condition and privacy all hold up potentially clearing 10%.
$10M+: equity liquidity plus scarcity. As long as AI company equity, public tech stock, family capital and family offices keep generating liquidity, this buyer pool keeps widening — Q2's +62% is the reading. Supply, meanwhile, has almost no elasticity. The number of genuinely top-tier homes the core cities can produce in a quarter is very small, and no rate environment changes that. Marie reads scarce core inventory at 10%–12% or more for 2027.
Three risks that could undo this call
Risk one: rates never come down. A 6.7% rate does constrain some buyers' purchasing power. It also continues to hold sellers in place. If core supply stays locked, the likelier outcome is a slower climb, not a turn downward.
Risk two: the AI wave cools. The buying power in this market does not come from any single AI company. Public tech equity, cross-border capital, local family offices and family businesses all feed it. AI determines how much new purchasing power arrives, not whether the market exists.
Risk three: listings surge in 2027. Q2 already ran a small-scale rehearsal. The $3M–$5M band went from 448 closings in Q1 to 822 in Q2, and the median premium over original list eased only from 6.0% to 5.3%. A meaningful share of that jump is ordinary spring seasonality and should not be read as a strengthening market — but it does show that when demand is present in step, more listings first produce more closings. The supply event worth putting on the calendar is the wave of adjustable-rate mortgages resetting around 2028 and 2029.
Q2 2026 key numbers: three bands against the market
The core numbers first. Across 57 cities in three counties, Q2 closed 5,941 single-family homes, up 3.5% year over year, with a median 12 days to contract. In the same quarter, $3M–$5M closed 822 homes, up 10%, at a median 105.3% of original list price. Above $10M closed only 47 homes — but up 62%, roughly 18 times the market's pace.
| Price band | Q2 closings | Year over year | Median days to contract | Sale price / original list | Cash share | Marie's 2027 read |
|---|---|---|---|---|---|---|
| Market (all prices) | 5,941 | +3.5% | 12 days | — | — | Forecast covers only above $3M |
| $3M–$5M | 822 | +10% | 8 days | 105.3% | 26.8% | Core cities +5%–8% |
| $5M–$10M | 279 | +26% | 8 days | 103.8% | 44.4% | +8%–10%; best-in-class homes may clear 10% |
| $10M+ | 47 | +62% | 25 days ($10M–$20M) / 44 days (above $20M) | 96.3% ($10M–$20M) / 91.5% (above $20M) | 71.8% ($10M–$20M) / 75.0% (above $20M) | Scarce core inventory +10%–12% or more |
Two things to remember. First, $3M–$5M and $5M–$10M both went to contract in a median of 8 days. Conventional wisdom says the more expensive a home, the slower it sells; these two bands moved at identical speed. Second, the numbers in the $10M+ row that look weak — 96.3%, 91.5%, 44 days — are not evidence of falling prices. They are a reading on pricing discipline. With only 47 closings in the whole quarter, one or two badly overpriced homes can drag a median a long way.
What MK Group sees on the ground
On YouTube @MarieWang (44K+), Marie Wang sums up the $10M+ tier in a line: when something scarce comes up, everyone moves at once. An MK Group transaction this May took exactly that shape. An architect had spent four years building a home to his own standard. It never reached the market; word moved through a small circle of agents. MK Group, representing the buyer, acted the moment the information arrived. The buyer booked the first flight out the next morning, toured, and decided that day. It closed at $18M. The buyer could have paid all cash and chose to finance roughly $10M instead, and the offer was not the highest on the table — the seller met the family and accepted that evening. (Full case)
Who these buyers are is changing too. Marie's front-line observation is that a meaningful share of her eight-figure buyers were born in 1996 or 1998, buying at that level on their very first purchase, with wealth created by the AI wave rather than inherited. A second MK Group case traces the same curve. A technology professional was touring with a $2M–$2.5M budget in early 2024. After receiving a large equity package at a leading company, that buyer closed on a newly built one-acre Atherton property for roughly $20M in early 2026. (Full case)
Marie also describes a family in the video: one spouse at a leading AI company, living in a mid-Peninsula townhome, with a second child on the way. They financed part of the purchase and bought an acre in Atherton for just over $10M. They wanted to solve it in one move — and they were worried 2027 would cost more.
Common Misconceptions
Misconception 1: "If rates don't come down, prices can't go up"
That logic counts only half the table. The same 6%-and-change rate pins owners holding 2.5%–3.5% mortgages exactly where they are — trading up means nearly doubling the borrowing cost, so they don't sell. Demand is suppressed and supply is suppressed together. In an environment where 2027 rates may still sit near 6.7%, the likelier outcome is a slower climb, not a reversal.
Misconception 2: "More listings means prices soften"
Q2 already answered this once. The $3M–$5M band went from 448 closings in Q1 to 822 in Q2, and the median premium over original list eased only from 6.0% to 5.3% — still above every band over $5M, where $5M–$10M ran 3.8%. Supply rose sharply and the premium barely gave ground. One caveat belongs with it: much of that increase is ordinary spring seasonality. What it proves is that more listings first produce more closings. It does not prove the market strengthened.
Misconception 3: "Homes above $20M closed at 91.5% of original list — the luxury tier is falling"
The spread inside those eight closings is far wider than the median suggests. Three sold in 4 to 18 days at 5.7%, 10% and 17.8% above original list. Several others were priced too high, sat 70 to 248 days, and closed only after repeated reductions. Put both kinds of home inside one median and the median looks bad. What is actually happening is not a falling luxury tier but a market growing less forgiving of pricing: overprice and you get ignored, bring something genuinely scarce and it still draws a crowd. (Of the eight, six were in Atherton, one in Woodside, one in Palo Alto.)
Misconception 4: "The market median rose only 0.9%, so luxury must be about the same"
That market median is the midpoint of 5,941 closings spanning every price point, pulled in both directions by sub-$1M homes and $20M homes at once. Split it apart and the same quarter shows $3M–$5M volume up 10%, $5M–$10M up 26% and $10M+ up 62% — three curves with entirely different slopes. Keep the condition attached to Marie's forecast in view as well: not every house rises. Anything priced unreasonably or carrying an obvious defect still cuts.
Next steps
- Buyers at $3M–$5M: settle the payment and household cash flow before you start touring. The median home in this band goes to contract in 8 days. When the right one appears, there is no time left to go back and run the math.
- Buyers at $5M–$10M: screen on asset quality, not price per square foot. Homes where location, land, privacy and condition all hold up will separate further from homes missing one or two of those over the next several years. Align the equity liquidity schedule with the touring schedule.
- Buyers above $10M: get inside the private channel early. Only 47 homes closed in this band in the entire quarter. Waiting for a public listing is likely to mean waiting past the one you wanted. Being willing to wait for the right house is sound; waiting with no line into the market is not.
- Sellers: price off comparable closings from the last 90 days, not off next year's expected gain. Those $20M+ homes that sat 70 to 248 days paid the price of a pricing error. Once the strongest week of demand — the first week on market — has passed, only reductions bring buyers back.
- Sellers: model concurrent competition alongside the comps. Who is chasing your buyers during your launch week shapes your pricing room as much as recent sales do — especially at $3M–$5M, where supply has already risen sharply.