Direct answer
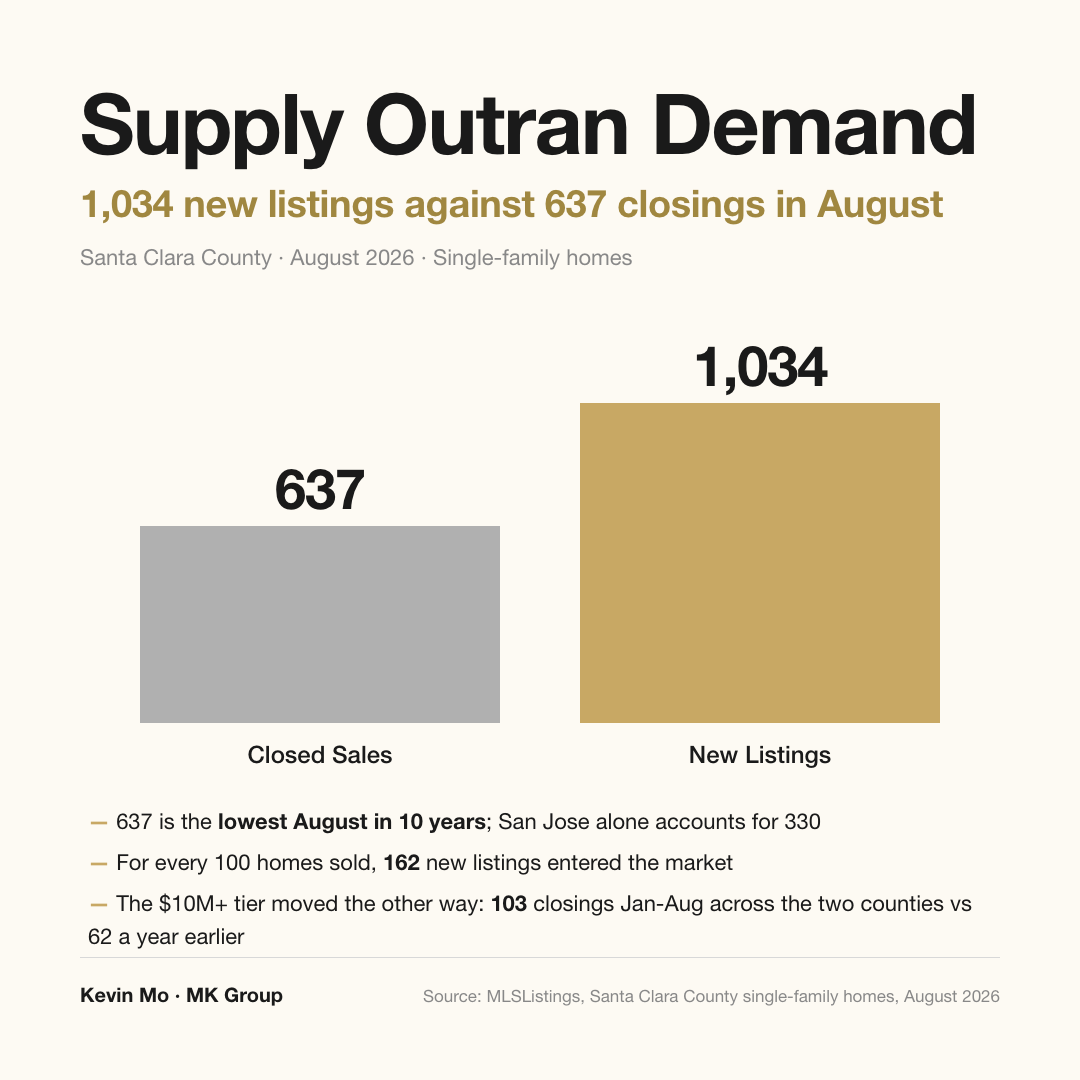
More to compare is not the same as room to negotiate. Santa Clara County closed 637 single-family homes in August, the lowest August in ten years, while 1,034 new listings came to market. What decides your offer is the competition around that particular house — not the county-wide direction.
Who this article is for
- Buyers touring single-family homes in Cupertino, Santa Clara or Sunnyvale who want to know how much leverage the extra inventory actually bought them
- South Bay owners planning an autumn or winter listing who read "lowest closings in ten years" and started doubting their price
- Owners considering a sale one or two years out who need to think the timing through now
- Owners of high-end Peninsula homes who want to know whether their segment is on the same curve as the county
- Buyers who read "median down 8.1% in this city" and assumed the same discount applies to the house they want
Three core dimensions
Dimension one: transactions froze — inventory was not dumped
Put August 2026 next to the 2022 cooldown and the result runs against intuition. In August 2022, 1,344 homes appeared on the market during the month. This August the count was 1,272 — fewer. Yet closings fell from 802 to 637.
Less inventory than 2022, fewer sales than 2022. What is holding this market down is not a flood of supply; it is a shortage of willingness on both sides. Many owners still carry a low rate on the house they live in. Trading up means a materially higher monthly payment, so they stay put. Buyers are waiting too. When both sides wait, volume freezes before anything else happens. A frozen market and a forced-selling market are two entirely different things.
Dimension two: the median is falling, and it may not be falling on the house you want
The county median is down 1.6% year over year, Sunnyvale is down 8.1%, the city of Santa Clara down 5.5%. Every one of those numbers is accurate. But each describes the midpoint of the homes that happened to close that month — not the change in value of any one house.
Price per square foot tells the more useful story. In the city of Santa Clara, the median fell while price per square foot rose. In Sunnyvale, the median fell 8.1% while price per square foot fell only 0.5% to 2.9%, depending on the method. The straightforward reading is that lower-priced homes made up more of August's closings, which pulls the median down even when high-end prices barely move. A falling city median does not entitle you to the same discount on the home you are watching.
Dimension three: the cooling is concentrated at the entry and mid tiers
From January through August, Santa Clara County and San Mateo County together closed 103 single-family homes above $10M, against 62 over the same stretch last year. The top of the market took a visibly larger share of total single-family volume.
That explains the scenes that seem to contradict each other. A renovated Palo Alto home draws a crowd at the door while a Cupertino listing sits quiet on a Sunday. A friend wins a house over asking, and the next morning the news says closings hit a ten-year low. Both are happening. The chill is concentrated in the entry and mid tiers, while high-end Peninsula housing remains in one of its historically strong stretches. Kevin Mo sums it up on YouTube @KevinMoRE (23K+) in a single line: the distance between what sells easily and what doesn't is getting wider.
August's key numbers: Santa Clara County single-family homes
The core numbers first. Santa Clara County closed 637 single-family homes in August, the lowest August in ten years, with San Jose alone accounting for 330. The same month brought 1,034 new listings — 162 new listings for every 100 homes sold. County closings fell 13% year over year, while the median price fell only 1.6%. Volume has moved; price has barely started to.
| Measure | August 2026 | Notes |
|---|---|---|
| Closings for the month | 637 | Lowest August in ten years; San Jose accounts for 330 |
| New listings for the month | 1,034 | 162 new listings for every 100 homes sold |
| Supply-to-closing ratio | 1.62 | The market's capacity to absorb new supply is worth watching |
| County closings | Down 13% year over year | Against August 2025 |
| County median price | Down 1.6% year over year | An official index that tracks repeat sales of the same homes shows a similarly small decline, pointing the same direction |
| Sale price / final list price | 102.8% | Counts only homes that sold, and measures against the last list price |
The one thing to remember. A ratio of 1.62 does not describe an inventory surge; it describes absorption failing to keep pace with new supply. Treat 102.8% with the same care. It carries survivorship bias — it is a race photographed only at the finish line, with everyone who slowed, withdrew or is still running left out of frame. And it measures against the last list price, so a home that cut its price and then closed above the reduced number still counts inside that 102.8%. It proves good homes still draw competition. It does not prove every home sells.
The gap between cities matters more than the county figure
The core numbers first. In Cupertino, homes on the market during the month rose from 18 to 50, with 39 still showing on public listing pages at month end. Sunnyvale's median fell 8.1% year over year on 41 closings, and the city of Santa Clara's fell 5.5% on 40. One county north, San Mateo County closings were up 5% year over year, inventory sat at a ten-year low for the month, and the Palo Alto median rose 11.3% year over year on 32 closings.
| City / area | August reading | Closings in the sample |
|---|---|---|
| Cupertino | Homes on the market during the month rose from 18 to 50; 39 still on public pages at month end | A pronounced jump in inventory |
| Sunnyvale | Median down 8.1% year over year; price per square foot down 0.5% to 2.9% depending on method | 41 |
| City of Santa Clara | Median down 5.5% year over year; price per square foot up | 40 |
| Palo Alto | Median up 11.3% year over year | 32 |
| San Mateo County | Closings up 5% year over year; inventory at a ten-year low for the month | County-wide |
The one thing to remember. Samples of 41, 40 and 32 are small enough that a handful of unusually expensive or unusually cheap homes can pull the midpoint a long way — so resist labeling a city "up" or "down." The same budget behaves differently across property types, too. Against a well-located, move-in-ready single-family home you may still have to compete; against a condo with many near-identical units and high monthly dues, you can afford to see several more before deciding. Every figure here describes single-family homes. Condos and townhomes behave differently, and these conclusions do not transfer.
Why this does not look like the start of a crash
What turns a mild decline into a sharp one is a growing number of owners moving from "would like to sell" to "have to sell" — job losses, missed payments, defaults, more foreclosures. That is how selling pressure reaches price.
That chain has not lit up. In San Mateo County, both notices of default and foreclosure transfers were lower in 2025 than in 2024. The data lags; it describes conditions through the end of 2025, cannot stand in for today and guarantees nothing about what comes next. But within this set of records, there is no sign of forced selling at scale.
The window worth putting on the calendar now is 2028 to 2029, when a wave of adjustable-rate mortgages reaches reset. Inventory could loosen meaningfully around that period, and some owners may choose to sell ahead of the end of their fixed-rate term.
Over the next two months, three things are worth tracking. First, whether new buyers go into contract fast enough to keep up with new listings — at 637 against 1,034 in August, that one is already flashing yellow. Second, whether homes sitting 30 and 60 days without a sale, and homes taking price cuts, increase noticeably. Third, whether job losses, missed payments and foreclosures rise together. The current data is not enough to confirm all three are deteriorating in step; only the first has turned yellow. That keeps the base case at a mild adjustment rather than a broad decline.
What MK Group sees on the ground: the gap opens before the listing goes live
In the same 2026 market that went on to post a ten-year low in August closings, a well-prepared, sensibly priced home can still sell quickly. An MK Group sell-side listing in Midtown Palo Alto that closed in May went that way. The owner described it as "a perfectly good, perfectly unremarkable house" — nothing wrong with it, nothing distinctive either. The listing agreement was signed in February; the family did not move out until late April, leaving roughly three weeks between the empty house and launch day. The months in between were not spent waiting. The home first went out privately to about 25 buyers already touring locally with cash behind them, which produced a verbal $4M offer while the property was still off market, against a $3.88M list price. Two to three pieces of content followed — one on the neighborhood, one on the house, one on the market. After launch came four days of open houses and roughly 110 groups through the door. It closed at $4.378M, about $500K over list, or roughly +12.8%. (Full case)
The other end of the spectrum is the decision not to sell. An owner of a 94087 single-family home — 1,800 square feet, three bedrooms, two baths, a 7,500-square-foot lot, Homestead schools — wanted to move up to Los Altos. Three agents consulted earlier all advised listing as soon as possible. After walking the property, Marie Wang and Kevin Mo gave the opposite advice: don't sell yet. The house had no real flaws and carried an extremely low rate, which disappears permanently at closing. The next step was undefined and the funds were not in place, which made a long stretch of "waiting for the market" the likely outcome. The alternative was to keep the low-rate property and raise the next down payment through a HELOC. The owner's response: "Oh my god, you're the only one telling him not to sell." (Translated from Mandarin.) (Full case)
Read against August's data, the two cases make one point. When buyers have more to choose from, nearly everything that changes the outcome happens before the listing goes live — either the first week on market is fully prepared, or the honest conclusion is that this is not the moment to list at all.
Common Misconceptions
Misconception 1: "Closings hit a ten-year low, so inventory must be flooding the market and prices are about to break"
Inventory is not flooding anything. In August 2022, 1,344 homes appeared on the market during the month; this August the count was 1,272 — fewer. Yet closings fell from 802 to 637. What is holding the market down is frozen willingness to transact: owners holding low rates don't want to trade up, and buyers are waiting. That is not forced selling. Notices of default and foreclosure transfers remain low in the available records, which run through the end of 2025, and show no sign of distress-driven supply.
Misconception 2: "The county median fell 1.6%, so the house I want should be 1.6% cheaper"
A median describes the midpoint of the homes that closed that month, not the change in value of a given house. The city of Santa Clara's median fell 5.5% year over year while its price per square foot rose. Sunnyvale's median fell 8.1% while price per square foot fell only 0.5% to 2.9%, depending on the method. When lower-priced homes take a bigger share of a month's closings, the median drops even if high-end prices barely move. What a specific house is worth still comes down to what comparable homes nearby have sold for recently.
Misconception 3: "Homes closed at 102.8% of final list price on average — clearly they're still selling well"
That number carries two biases. First, it counts only homes that sold; everyone who slowed down, withdrew or is still on the market is outside the sample. Second, it measures against the last list price — a home that cut its price and then closed above the reduced number lands inside that 102.8% all the same. The three metrics people quote most often — sale performance, absorption speed and price level — all see only the homes that sold, which is why they tend to look good at the same time. What 102.8% proves is that good homes still draw competition, not that every home sells.
Misconception 4: "A house down the street just sold for $2M, so mine is worth $2M"
Take a hypothetical. That house may have just been renovated, sat on a larger lot, and drawn five offers. Yours has been on the market 25 days, with two neighboring listings competing for the same buyers. Same "$2M down the street," and a wide gap between what each home should reasonably fetch. Getting answers to those conditions before you write an offer is worth far more than reading the county trend.
Misconception 5: "Sunnyvale is down 8.1%, so the whole Bay Area is falling"
In the same August, San Mateo County closings were up 5% year over year, inventory sat at a ten-year low for the month, and the Palo Alto median rose 11.3% year over year. Sunnyvale's 41 closings and Palo Alto's 32 are small samples in which a few homes can move the midpoint. And every one of these figures describes single-family homes only. Condos and townhomes have a different supply-and-demand structure — do not carry the conclusion across.
Next steps
- Buyers: ask four questions before you offer. How many comparable homes are on the market today? How long have they been listed? Have any cut their price? What did genuinely similar homes actually close for recently? Those four answers determine your number far better than the county trend does.
- Buyers: treat "three real comparables" as your entry condition. Cupertino, Santa Clara and Sunnyvale all saw a marked rise in inventory in August. More listings does not mean every listing is negotiable, but having three options in your price band beats having one. Bay Area pricing windows have always been short, Santa Clara and Sunnyvale are among the more volatile cities, and any softness in Cupertino is rarer still.
- Sellers: price off the last 90 days of comparable closings. Don't let a neighbor's peak number from last year set this year's starting line. Equally important is who will be competing for your buyers during your first week on market — the number and quality of concurrent listings belongs in the pricing model alongside the comps.
- Sellers: if you're waiting a year or two, put the ARM reset schedule on your timeline. The closer the calendar gets to 2028 and 2029, the more owners may list ahead of the end of their fixed-rate term, and the more competition similar homes may face.
- Everyone: track three things over the next two months. Whether new contracts keep pace with new listings; whether 30- and 60-day unsold inventory and price cuts increase noticeably; whether job losses, missed payments and foreclosures rise together. Only all three moving in step signals a clear downturn — right now just the first is flashing yellow.