Direct answer
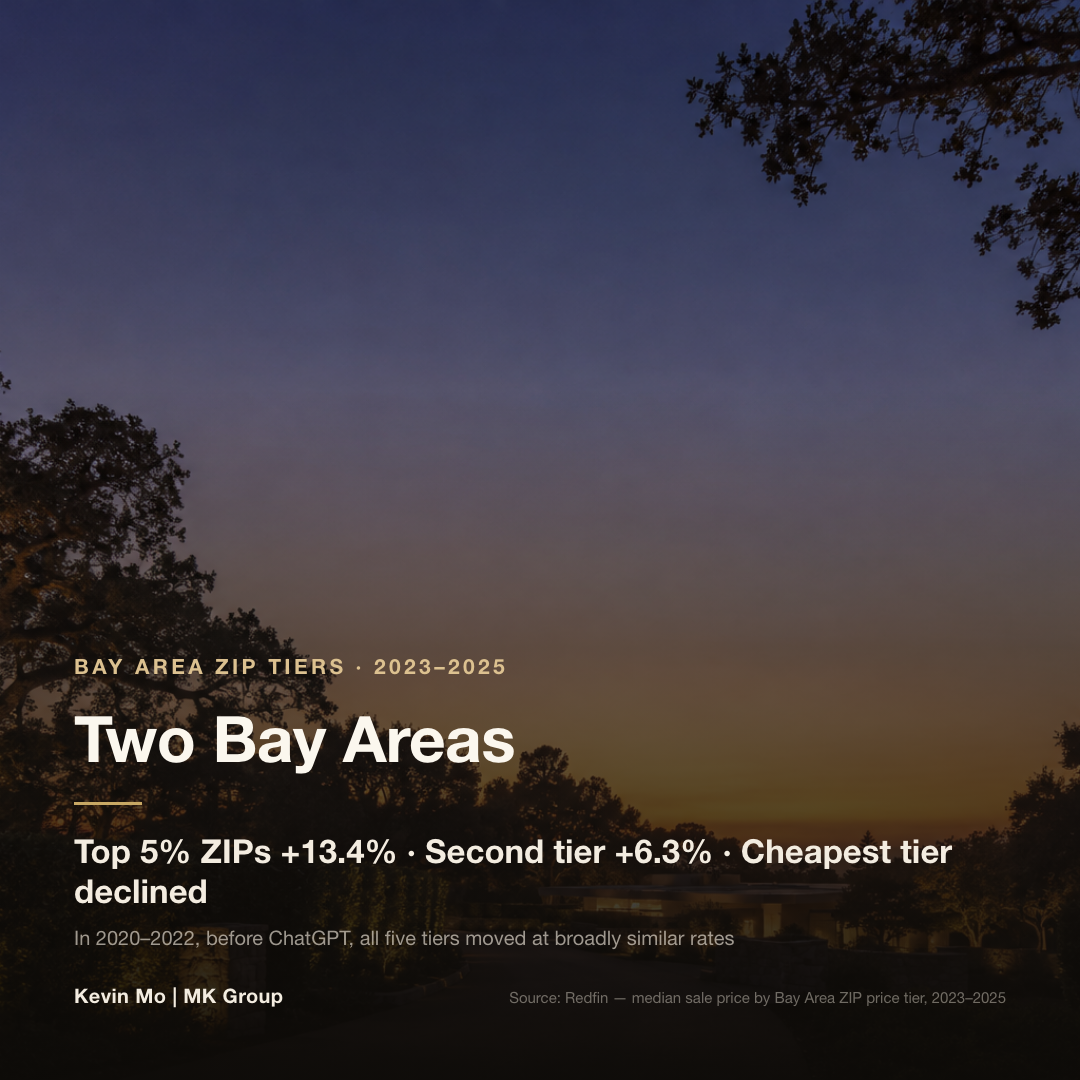
Because the money repricing that house does not come from payroll. Redfin's ZIP-tier comparison shows the most expensive 5% of Bay Area ZIP codes gained 13.4% in median sale price between 2023 and 2025, the second tier gained 6.3%, and the cheapest tier declined. What lifts Palo Alto is equity turning into cash. A raise sits on a different curve.
Who this article is for
- Dual-income households drawing a W-2 salary at a Bay Area tech company while also holding RSUs or options
- Buyers targeting single-family homes in Palo Alto, Los Altos, Menlo Park or Atherton, with a budget of roughly $3M–$8M and up
- Families whose income keeps rising while the list of homes they can actually buy keeps getting shorter
- Anyone holding pre-IPO shares or exercisable options who wants to get the sequencing of a home purchase right
- Owners already in a core neighborhood who want to understand who the next few years of buyers will be
Three core dimensions
Dimension one: what got repriced is the location; the house is only the container
The past two years in the Bay Area were not a broad boom. They were a split between the top and everything else. The top 5% of ZIP codes rose 13.4%. The cheapest tier fell. Between them sits a second tier at 6.3% — one metro, one interest-rate environment, three different directions. That is why a countywide median tells you nothing useful about whether to move now; only the tier your target ZIP sits in counts. The full breakdown is in the K-shaped split in Bay Area housing.
Dimension two: your tier is set by how much you own, not by how fast your salary climbs
A salary has a budget behind it, a level, a replacement, and a hard ceiling in hours — there are 24 in a day. A share of equity, a piece of software, a patent can be copied and sold an unlimited number of times, with no theoretical ceiling. For a household drawing both W-2 income and RSUs, that distinction is concrete: what share of the family's balance sheet comes from selling time, and what share comes from owning? That ratio predicts which tier of neighborhood you are standing in three years from now better than base pay does.
Dimension three: AI drives down the cost of what can be copied, not the price of what is scarce
AI is very good at making a report, a block of code, an introductory course cheap. It cannot copy an acre of Atherton. It cannot add houses to the most central blocks of Palo Alto, and it cannot conjure schools, medical resources and community networks of the same quality on any short timeline. The result is a contradictory world: digital services keep getting cheaper while scarce locations keep getting more expensive. Absolute living standards improve. The asset threshold that buys real optionality rises faster.
Four data points: where the money is going
The headline number first. Redfin sorted Bay Area ZIP codes into five price tiers and compared 2023 to 2025: median sale prices in the top 5% of luxury ZIPs rose 13.4% on average, the second tier rose 6.3%, and the cheapest tier declined — while in 2020 to 2022, before ChatGPT, the five tiers rose at broadly similar rates. Separately, Federal Reserve data for 2026 Q1 shows the top 10% of households holding about 87.4% of corporate equities and mutual fund shares, against about 1.1% for the bottom 50%.
| Measure | Figure | Source | Note |
|---|---|---|---|
| Median sale price change by ZIP price tier (2023→2025) | Top 5%: +13.4%; second tier: +6.3%; cheapest tier: declined | Redfin ZIP-tier analysis | In 2020–2022 the five tiers rose at broadly similar rates; the split is recent |
| US household holdings of corporate equities and mutual fund shares | Top 10%: about 87.4%; bottom 50%: about 1.1% | Federal Reserve Distributional Financial Accounts, 2026 Q1 | On total net worth: top 10% about 67.9%, bottom 50% about 2.5% combined |
| Wage Gini vs wealth Gini (model simulation) | Wage Gini −1.73 percentage points; wealth Gini +7.18 percentage points | IMF 2025 model study, built on UK household data | A mechanism model, not a precise forecast |
| AI / machine-learning engineer pay and equity (2024-01→2026-02) | Median salary +9.1%; median initial equity grant +31% | Carta | Over the same period, average Series D headcount is 29% below the 2023 peak; median seed-stage team is 4 people |
Two things to remember. First, the IMF pair only looks contradictory: wage gaps compress at the same time wealth gaps widen. Labor income gets flattened; returns to capital concentrate. Second, Carta's 9.1% against 31% is the line closest to your own paycheck. Same engineers, same market — equity climbed more than three times as fast as pay. The extra points of base you win in an offer negotiation and the equity column are moving at different orders of magnitude.
Why a raise can't catch up: two curves, two magnitudes
Put it in ordinary terms. Your salary goes up 5% in a year; the neighborhood you want goes up 13%. You save $100,000; someone else's company equity gains $10 million. You buy an asset with twenty or thirty years of accumulated labor; someone else buys it with one financing round or one tender offer. Nothing was taken out of your account. Scarce assets are simply being repriced at a speed you cannot match by earning.
Shrinking teams sharpen the effect. Average headcount at Series D companies is 29% below the 2023 peak, and the median seed-stage team is 4 people. The likelier future is not every AI engineer earning without limit — it is fewer people, using AI, doing work that once took more, with a very small number holding the equity that captures the upside. A rank-and-file employee might get a 10% to 20% pay premium, or better. A company valuation can go from $1 billion to $10 billion. That gap also explains why the all-cash share of Silicon Valley buyers keeps reaching levels that look counterintuitive: that money was never saved up in the first place.
What MK Group sees on the ground
From the front line of the Bay Area luxury market, Kevin Mo (DRE# 02127623, YouTube @KevinMoRE, 23K+ subscribers) is watching something most people will feel a few years from now: not everyone getting poorer together, but a small group whose wealth is compounding away from everyone else. It shows up first in transactions in scarce locations, which makes residential real estate the seismograph of this split — it registers how fast new wealth appears and where it lands.
One transaction in the MK Group case library spells out the mechanism (case-007, Los Altos Hills). A family employed at a leading Silicon Valley AI company converted pre-IPO shares to cash in tranches through the secondary market, then bought a Los Altos Hills estate all-cash; MK Group took over the negotiation and brought the price down by more than $1 million from asking (the absolute sale price is not disclosed). That family reached Los Altos Hills through ownership converted to liquidity. Pay stubs barely appear in the story. Households holding pre-IPO stock have a separate sequencing problem to solve — see the pre-IPO employee's Bay Area home plan.
The boundary matters: this is an observation about how the market works, not investment advice. MK Group was co-founded by Marie Wang (DRE# 02110980) and Kevin Mo, and what the team can do is make transaction data and buyer composition legible. Whether to hold any particular stock is a decision between you, your CPA and your financial advisor.
Common Misconceptions
Misconception 1: "If I keep getting promoted, I'll get to Palo Alto eventually"
That path assumes the two curves have similar slopes. The data says otherwise. A 5% annual raise against a target neighborhood up 13.4% over two years widens the gap instead of closing it. Raises are good; they cannot finish this job alone. What changes your tier is how much of the family balance sheet is owned rather than earned.
Misconception 2: "Bay Area prices are up overall, so the tier doesn't matter"
From 2023 to 2025 the top 5% of ZIP codes rose 13.4%, the cheapest tier declined, and a 6.3% second tier sat between them. Reason from a Bay-Area-wide median to your target neighborhood and you can get the direction exactly backwards. Buying core Palo Alto and buying the outer ring were two entirely different trades over the past two years.
Misconception 3: "AI makes everything cheaper — housing will follow"
What AI makes cheaper is anything that can be copied without limit: reports, code, images, introductory courses. It cannot copy an acre of Atherton or add homes to the most central blocks of Palo Alto. Cheaper digital services and pricier scarce locations are two ends of the same mechanism.
Misconception 4: "If I learn a few prompts, my career risk is hedged"
Treating AI as a set of prompts is the preparation most likely to come up short. The scarce combination is domain expertise plus AI fluency plus judgment, accountability and trust between people. AI can draft ten proposals in a minute; who knows which one survives execution, who catches the buried error, who will stand behind the outcome — that is still human work. The people under the most pressure are not only those who never learned the tools, but also the middle layer whose work is highly standardized and who have built no independent judgment and no client trust.
Misconception 5: "This is just me not working hard enough"
Not everyone falling behind in this wealth gap is falling behind on effort. Broader access to AI tools, retraining that actually works, more housing supply, and mechanisms that let workers share in productivity and capital gains all require companies, institutions and public policy. Technology decides how much wealth a society can create; ownership structure decides who ends up holding it. Internalizing a structural problem as personal anxiety sends your energy to the wrong place in a family decision.
Next steps
- Pull the numbers for your target ZIP's tier on their own. Skip the Bay-Area-wide median. What you need is the median sale price and two-year change for Palo Alto, Los Altos, Menlo Park and Atherton separately — the distance between +13.4% and "declined" is the cost of using the wrong benchmark.
- Calculate how much of your balance sheet is owned. List salary income separately from equity, long-term investments and intellectual property, and see which side is compounding for you. In an era of fast-rising returns to capital, owning only your labor gets more passive every year.
- Convert part of your labor income into ownership that compounds. That can be diversified long-term investments, equity in your own business, intellectual property, a brand, a client network, or a system that no longer depends on you selling hours. This is not a suggestion to chase any single stock, and it is certainly not encouragement to stretch beyond what your household can carry in order to buy.
- Rebuild your professional moat around judgment and trust. Domain expertise plus AI fluency plus judgment and accountability will shape the next decade of your income far more than another handful of prompts.
- If you hold pre-IPO stock or a large unexercised position, sequence the money before you tour homes. Liquidity path, tax timing and purchase window get planned together — don't find the house first and solve the funding afterward. On valuation risk, see what an AI bubble correction would do to Bay Area home prices.