Direct answer
Not yet. In July, South Bay homes closed at 100.6% of list price and 56% sold above asking, almost exactly where they were a year earlier. That is not a buyer's market. The national gap should change how you prepare for your first week on market, not what you put on the price line.
Who this article is for
- South Bay and Peninsula owners planning to list in the next 6 to 12 months who read the national headline and started second-guessing their price
- San Francisco and northern East Bay owners planning to list in the same window who want to know how much leverage they still hold
- Owners who had the house valued back in June and are now preparing an autumn launch
- Owners trying to reconcile Redfin's "near a two-year low" with NAR's "quite stable"
- Owners who want the real numbers for their own ZIP code and price band before they commit to a list price
Three core dimensions
Dimension one: the buyer pool has changed character, and your house meets a harder audience
National buyer counts are at their lowest level since 2013, which tells you how many people are sitting out. The consequence for a seller is not that nobody is buying. It is that the buyers still in the market are pickier, slower and far better at comparing. They have toured more houses, they carry a fuller set of comparables in their heads, and they have less patience for a price that assumes competition.
That makes the first week on market matter more than it has in years. In a hot market, a rough launch could be rescued by buyers bidding against each other. That rescue is no longer reliable. Miss this audience in week one and the rest of the listing is a cycle of price cut, more days on market, another price cut.
Dimension two: the 39 buyer's markets are real, and they describe housing somewhere else
Of the 49 metros Redfin tracks, 39 are buyer's markets — close to 80%. The three widest gaps are Miami, where sellers outnumber buyers by 154%, Nashville at 150.8% and Houston at 129.8%. In markets like those, buyers take their time, negotiate on price, and ask the seller to handle repairs before closing.
Those findings apply to one situation: your next purchase sits outside the Bay Area, in Texas, Florida or Arizona. They do not describe the market your Bay Area house is walking into. The one clearly looser segment inside the Bay Area is South Bay and Peninsula housing under $1.5M — that is where the buyers who are still bidding have the most room, and if your home sits in that band, plan for a negotiation rather than a bidding war.
Dimension three: this is an early signal, and the order matters more than the date
Markets turn in a fixed sequence. Buyers leave first. Sales volume falls second. Prices move third. Nationally we are somewhere between the first and second step. The Bay Area has not reached that point.
For an owner selling within 6 to 12 months, the sequence answers one question: do I need to hurry? Only when closed sales in your own ZIP code decline for several consecutive months does the price side start to give. Cutting your price because national buyer counts hit a 13-year low skips the two steps in between.
What actually happened nationally between February and July
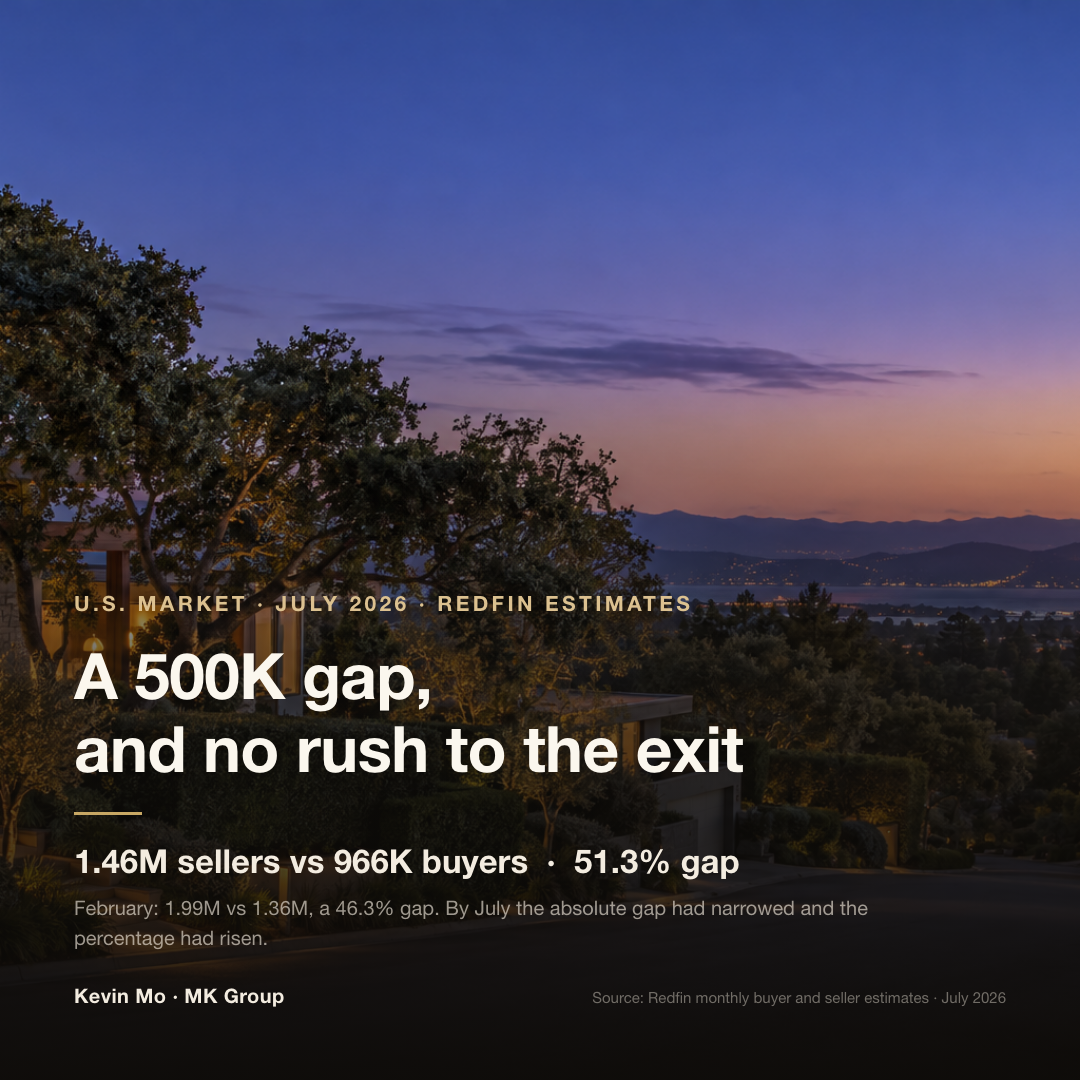
The core numbers first. In February there were roughly 1.99M sellers against 1.36M buyers — about 630,000 more sellers, the largest absolute gap since Redfin's records began in 2013, and 46.3% in percentage terms. By July, sellers had fallen to about 1.46M and buyers to 966,000. The absolute gap narrowed to roughly 500,000, yet the percentage climbed to 51.3%. Fewer people in the gap, a bigger gap on paper, because the denominator shrank faster than the numerator.
| Measure | February 2026 | July 2026 | Change |
|---|---|---|---|
| Sellers | ~1.99M | ~1.46M | Down; July fell 0.3% month over month |
| Buyers | ~1.36M | ~966K | Down; lowest since 2013 |
| Absolute gap | ~630K | ~500K | Narrowed by roughly 130K |
| Sellers over buyers | 46.3% | 51.3% | Up 5 percentage points |
| Historical marker | Largest absolute gap since records began in 2013 | Below the December 2025 record of 51.8% | Near the record, not past it |
The one thing to remember. 51.3% is not a record; the record is 51.8%, set in December 2025. And seller counts fell only 0.3% month over month in July, to their lowest level in a year — no wave of owners is rushing to list. Almost all of this round's widening came from buyers stepping back faster than sellers did.
Why buyers left: two sets of numbers that have nothing to do with houses
Freddie Mac's latest 30-year fixed rate is 6.67%, just under the 6.69% high of the past year and 9 basis points above where it sat a year ago. The rate cut buyers waited a year for never arrived. Employment softened alongside it: the U.S. Bureau of Labor Statistics (BLS) reported that July nonfarm payrolls fell by 23,000, that May and June were revised down by a combined 103,000 jobs, and that average hourly earnings rose 3.2% year over year, the slowest pace since May 2021. Work feels less secure, raises are thinner, and borrowing costs are near a one-year high. As Kevin Mo puts it in the video, buyers haven't stopped wanting to buy — they can't make the numbers work. That is where the 500,000 gap comes from.
Same July, opposite headlines: Redfin and NAR
In a report published August 12, 2026, Redfin said seasonally adjusted existing-home sales fell 4.1% month over month in July, close to a two-year low, with San Antonio down 12.6%, Dallas down 10% and Seattle down 9.1%. For the same month, the National Association of Realtors (NAR) reported existing-home sales up 0.7% year over year, and its chief economist described the market as quite stable.
Both are right. Redfin's "near a two-year low" describes a seasonally adjusted annualized level; NAR's "stable" describes a year-over-year comparison. Redfin's own table shows sales down just 0.6% year over year for the same period, which points the same direction NAR does. The two houses also count different annualized totals — 4.06M at NAR, 4.26M at Redfin. Different methods, two numbers that should never be mixed.
The same July, 33 percentage points apart inside the Bay Area
The core numbers first. Sorting July's closed sales by three-digit ZIP prefix, sale price relative to list price ran from 100% all the way to 133%. South Bay printed 100.6%, with 56% of homes closing above list — nearly identical to July 2025. In San Francisco, 85% of single-family homes closed above list, and the single-family median rose from $1.63M a year ago to $2.05M, up 25.8% year over year.
| Area | Share closing above list | Sale-to-list ratio | What it means for a seller |
|---|---|---|---|
| South Bay | 56% (63% in June) | 100.6% | Level with July 2025; closer to normal than to a buyer's market |
| Peninsula | Varies widely by ZIP prefix | Inside the 100%-133% range | Has to be read at your own ZIP code and price band |
| San Francisco / northern East Bay | 85% (San Francisco single-family) | 124%-133% in some prefixes | Leverage is still with the seller, though the ratio carries listing strategy |
The one thing to remember. A high premium over list is not the same as fierce demand. A large share of that 100%-to-133% spread comes from how homes were priced going in: where underpricing is common, the calculated premium is mechanically higher. To judge whether a market actually moved, read the sale price itself. San Francisco's single-family median rising 25.8% year over year is a number no listing strategy can manufacture.
What MK Group sees on the ground: what the first week is worth
Once buyers turn selective, almost all of a seller's remaining influence sits before the listing goes live and inside the first week. Two MK Group sell-side cases in Palo Alto show two ways to use that window.
The first was a four-bedroom, three-bath single-family home in Midtown Palo Alto. The owner described it as a perfectly good, perfectly unremarkable house — nothing wrong with it, nothing distinctive either. The listing agreement was signed in February, the family did not move out until late April, and only about three weeks separated the empty house from the launch. The two months in between were not spent waiting. The home went out privately to roughly 25 buyers already touring locally with cash behind them, which produced a verbal $4M offer while the property was still off market, against a $3.88M list price. Two to three pieces of content followed, one on the neighborhood, one on the house, one on the market. After launch came four days of open houses, with about 110 groups through the door. It closed at $4.378M — roughly $500K over list, about +12.8%, and about $380K above what the off-market channel had been willing to pay. When the house itself is unremarkable, the premium comes from distribution and execution.
The second case went the opposite way. The owner of a home in a gated Palo Alto community was most concerned about the process cost of open houses: the community requires the listing team to staff two people on site, one at the gate and one at the house, and the owner faced roughly $100 a day in open-house costs with no defined timeline to a sale. Before the listing went live, MK Group published a pre-launch video about the property on its own media channels. One buyer watched it, made contact directly, skipped the long comparison shopping most buyers do, and delivered an all-cash offer within 48 hours of seeing the house. Zero open houses. The property had been widely considered a difficult sell.
What the two share is where the effort went: before the listing, rather than after a price cut. That is the point Kevin Mo returns to on YouTube @KevinMoRE (23K+), and it is the frame this article applies to an autumn listing. The national numbers change how demanding your buyers will be. They do not change the pricing baseline for your particular house.
Common Misconceptions
Misconception 1: "Nearly 80% of U.S. metros are buyer's markets, so the Bay Area is next — I should cut my price to be safe"
If you are selling in the South Bay and you shade your price down because 39 metros turned, you have shaded it in the wrong direction. South Bay homes closed at 100.6% of list in July with 56% above asking, almost exactly last July's reading. That is closer to a normal market than to a buyer's market. The national conclusion is an average across 49 metros. It is not your ZIP code.
Misconception 2: "The gap shrank from 630K to 500K, so the market is recovering"
The gap shrank because sellers and buyers both declined, and buyers declined faster. Seller counts fell 0.3% month over month in July, to their lowest level in a year, while buyer counts hit their lowest level since 2013 — which is why the percentage gap widened from 46.3% to 51.3% even as the headcount gap narrowed. A narrowing absolute gap here signals cooling on both sides, not returning demand.
Misconception 3: "Redfin says near a two-year low, NAR says quite stable — one of them must be spinning"
Both are accurate; the measures differ. Redfin is describing a seasonally adjusted annualized level down 4.1% month over month. NAR is describing sales up 0.7% year over year. Redfin's own data shows the same period down just 0.6% year over year, which does not contradict NAR. The two annualized totals were never the same to begin with — 4.06M at NAR, 4.26M at Redfin. When you read a housing headline, check whether it is month over month or year over year, and whether it is a seasonally adjusted rate or actual closings, before deciding whether the number applies to you.
Misconception 4: "Some San Francisco ZIP prefixes are printing 133% of list, so I can price high and still get there"
If you are selling in San Francisco or the northern East Bay, you do still hold leverage: 85% of homes closed above list. But do not read 124%-133% as a premium you are entitled to. Much of it reflects how those homes were listed — set the list price low and the calculated ratio rises on its own. The right use of that leverage is a fully prepared first week, not an inflated list price on day one.
Misconception 5: "San Francisco single-family prices are up 25.8%, so the whole Bay Area is rising"
The 25.8% is the year-over-year change in the San Francisco single-family median, from $1.63M to $2.05M. It describes San Francisco single-family homes and nothing else. In the same July, the South Bay's above-list share was essentially flat against a year earlier, with no move of comparable size. Inside one Bay Area, sale-to-list ratios ran from 100% to 133%. What matters is your area and your price band.
Next steps
- Pull your own ZIP code data first. Assemble the last six months of closed single-family sales in your three-digit ZIP prefix: sale price, sale-to-list ratio, and the trend in the share closing above list. A finding averaged across 49 metros cannot substitute for that table.
- Price off July, not June. If you are selling in the South Bay or on the Peninsula, rebuild your pricing assumption around 56% closing above list rather than June's 63%, and check whether your target number still holds.
- Move budget and time to the pre-listing window. Repairs, clearing out, photography, neighborhood content and private buyer matching all belong before launch day — not two weeks in, after the market has gone quiet.
- Schedule the first week as your only shot. Set the broker tour, the open house sessions and the online release rhythm in advance, so that every one of these slower, more selective buyers has seen the house within seven days.
- Watch closed volume, not headlines. Record the number of closed sales in your ZIP code once a month. Buyers leave before volume falls, and volume falls before prices move — the signal that justifies a price adjustment is several consecutive months of declining volume in your own ZIP code, not a national buyer count at a 13-year low.