Quick Answer
If you already expect to sell or trade up within two or three years, start the calendar now: a 7-year ARM taken out in 2021 resets around 2028, and one from 2022 resets around 2029. By then you may be negotiating with more than buyers. You may be competing with sellers who look exactly like you.
Who this article is for
- Owners who bought a primary residence in the Bay Area in 2021 or 2022 using a 7-year ARM and are now thinking about when to list
- Families holding a $3M–$4M home in a core city — Palo Alto, Los Altos, Menlo Park, Cupertino, Sunnyvale — who plan to move up to $5M–$6M within the next two or three years
- Owners whose former residence is now a rental, weighing whether the cash flow still justifies holding once the rate adjusts
- Anyone treating the current house as a stage rather than a destination, and deciding whether they want another 5 or 10 years of it
- Sellers already in conversation with an agent who have not yet put their loan terms and their listing date on the same page
Three core dimensions
Dimension one: 2021 and 2022 are not the same event, and your purchase year sets the clock
People file 2021 and 2022 together under "the low-rate era." The two years behaved very differently, and that difference decides which year you should be counting back from.
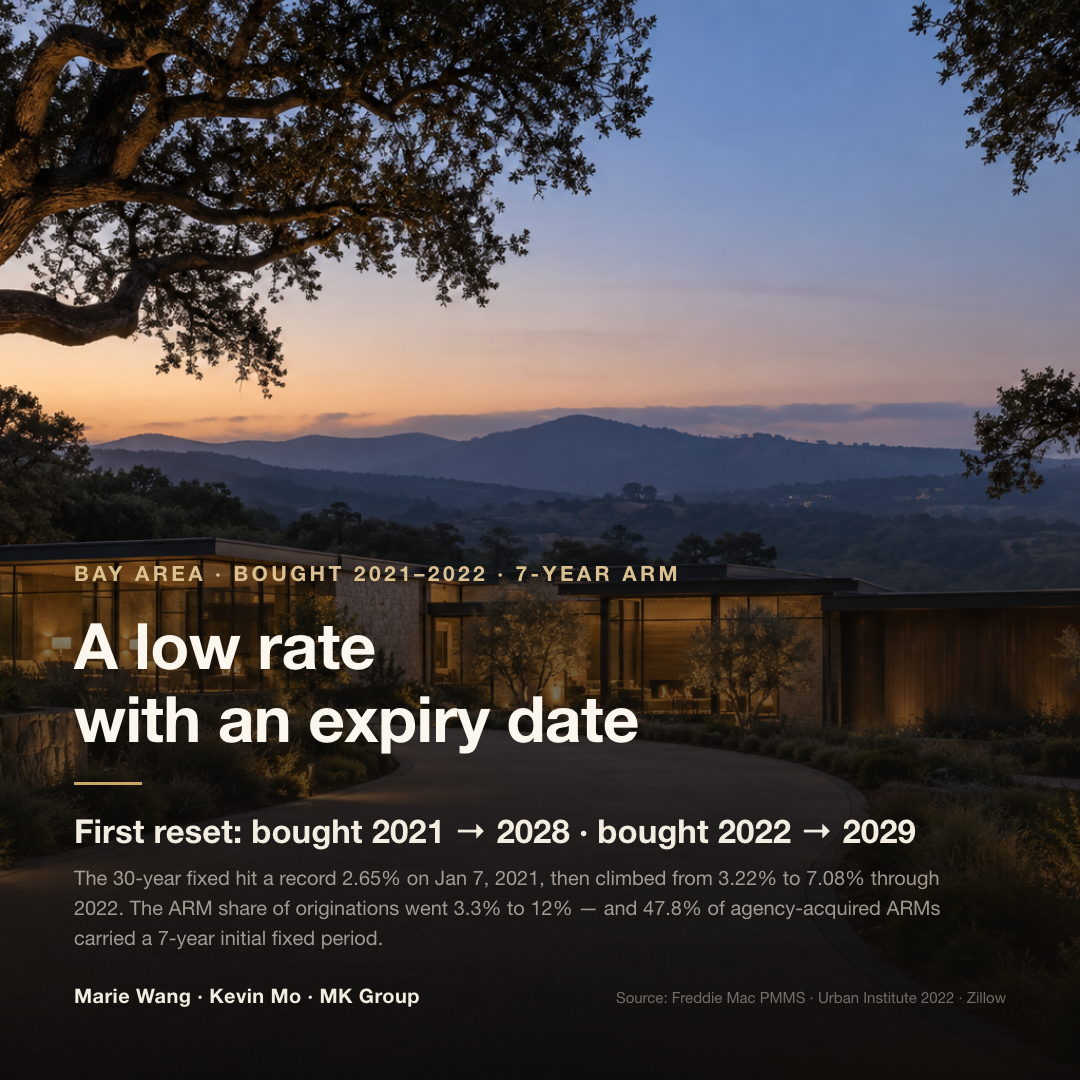
The true record low landed in early 2021. Freddie Mac's weekly Primary Mortgage Market Survey put the average 30-year fixed rate at 2.65% on January 7, 2021, with the full year averaging roughly 3%. Rates did not hold there. In the same series, the 30-year fixed climbed from 3.22% on January 6, 2022 to 7.08% on October 27 and again on November 10, 2022.
So 2021 was the peak year for locking in a cheap fixed loan. Only after fixed rates turned expensive in 2022 did the ARM become attractive again. That is why, when you map the first rate adjustment on a 7-year ARM, 2028 is the leading edge and 2029 is the year worth watching. Buyers who used an ARM in 2021 were an early, thin cohort. Anyone who closed a loan in the second half of 2022 is far more likely to reach the reset alongside a crowd.
Dimension two: the owners who actually sell after a reset are not the ones who cannot pay
Urban Institute research from 2022 found ARMs rising from 3.3% of all mortgage originations in November 2021 to 12% in November 2022. Zillow's analysis of loan applications shows the same shift from a different angle: in June 2022, ARMs briefly reached 12.6% of applications. The more useful number sits one level down. Working from origination data on the ARMs Fannie Mae and Freddie Mac acquired between 2020 and 2022, the Urban Institute counted 19.5% with a 5-year initial fixed period, 47.8% with 7 years, and 32.7% with 10 years. Within that agency sample, close to half of all ARMs were 7-year products.
Draw the boundary clearly, because it matters. That 47.8% covers only ARMs meeting Fannie Mae and Freddie Mac purchase standards. It does not describe the Bay Area, and it certainly does not describe the jumbo and portfolio loans that finance most $3M–$4M homes here. You can make a reasonable inference from loan economics — the larger the balance, the more absolute dollars a rate spread saves, so jumbo borrowers may well have used ARMs at a higher rate — but treat that as inference. No Bay Area lending data has confirmed it. The defensible statement is narrower: ARM usage rose sharply in 2022, and a meaningful share of those were 7-year products whose initial fixed period ends in and around 2029.
The same boundary corrects a second assumption. ARMs are not a product for stretched buyers. Analysis from the Federal Reserve Bank of St. Louis using the 2019 Survey of Consumer Finances found that among households with a mortgage, 18.8% of those in the top income decile held an ARM, against 6.5% in the bottom decile — and ARM holders had a higher median household income. The logic is plain. An ARM ran roughly 2% below the fixed rate at the time, and the same spread applied to a $3M loan is far more compelling than on a $1M loan. On $3M, the monthly savings can equal a household's entire monthly cost of living. These are national figures, not a direct count of Bay Area owners in the $3M–$4M band.
What a reset really triggers, then, is a fresh round of arithmetic. Three kinds of owners recalculate that month. The one whose house is now rented asks whether the post-adjustment cash flow still earns its keep. The one already planning to move from $3M–$4M to $5M–$6M asks whether the old house still deserves a place on the balance sheet. The one treating this as a stage home asks whether they want another 5 or 10 years of it. The sellers who eventually reach the market are usually the people who wanted to sell all along — the low rate simply kept handing them a reason to wait. A payment they cannot afford is rarely the story.
Dimension three: lock-in is a deferral, not an exemption — and an ARM's deferral expires
For several years now, one force has shaped the American housing market more than any other: mortgage rate lock-in. Hold a loan near 3%, sell, and buy again, and you replace it with a loan at a visibly higher rate. Even when life has moved on, plenty of owners decide to sit tight rather than give that rate up.
Research from the Federal Housing Finance Agency estimates that lock-in removed roughly 1.72 million home sales nationally between the second quarter of 2022 and the second quarter of 2024. On average, for every percentage point the market rate sat above an owner's existing fixed rate, the probability of selling fell about 18.1%. Among the 150 major metros in that study, San Jose–Sunnyvale–Santa Clara posted an average rate delta of −3.01 percentage points — the most locked-in metro in the country — with local sensitivity to lock-in running near 25.6%.
One caveat belongs here. The FHFA study measured lock-in on fixed-rate loans. It was not forecasting ARM resets. But it establishes something important on its own: the Bay Area's thin supply today does not mean these owners never want to sell. A real share of them are simply priced out of moving, because surrendering the old rate costs too much.
That is exactly where the structural difference sits. A fixed-rate loan, held, can carry its rate through the full term. A 7-year ARM's initial fixed period has an end date written into the note. On current trends, the rate after the first adjustment will most likely land above 2021 levels — though nobody can read today's market and declare what your ARM will reset to in 2029. The number is unknown. The requirement to run the math again is not.
The numbers: rates, ARM share, and the reset calendar
Key numbers first: the 30-year fixed hit a record 2.65% on January 7, 2021, then climbed from 3.22% to 7.08% over the course of 2022. Across the same window, ARMs went from 3.3% to 12% of all originations, and 47.8% of the ARMs the agencies acquired carried a 7-year initial fixed period. Chain those together and you get a calendar: buyers from 2021 reset around 2028, buyers from 2022 around 2029.
| Point in time | Reading | What it means for a 7-year ARM owner |
|---|---|---|
| Jan 7, 2021 | 30-year fixed at 2.65% (record low) | This was the peak year for locking in a cheap fixed loan |
| Full-year 2021 | 30-year fixed averaged about 3% | Fixed was still cheap; the ARM had little relative edge |
| Jan 6, 2022 | 30-year fixed at 3.22% | Fixed begins getting expensive; ARMs regain appeal |
| Oct 27 and Nov 10, 2022 | 30-year fixed at 7.08% | The year's high; ARM usage rose sharply through 2022 |
| Nov 2021 to Nov 2022 | ARM share of all originations 3.3% to 12% | On an application basis the share touched 12.6% in June 2022 (Zillow) |
| Agency ARM acquisitions, 2020–2022 | 5-year 19.5% / 7-year 47.8% / 10-year 32.7% | Close to half carried a 7-year initial fixed period |
| Bought 2021 with a 7-year ARM | First reset around 2028 | The leading edge — a relatively small group, judging by ARM share |
| Bought 2022 with a 7-year ARM | First reset around 2029 | The year that deserves closer attention |
Scope: rates are Freddie Mac PMMS weekly 30-year fixed averages, national. ARM share and the 5/7/10-year split come from Urban Institute 2022 research; the split covers only conforming ARMs acquired by Fannie Mae and Freddie Mac, excluding jumbo and portfolio loans. Application share is from Zillow's loan-application analysis.
What to remember: two things. First, 47.8% answers the question "how many agency ARMs were 7-year products," not "how many Bay Area owners reset in 2029." Those are very different sentences, and the first one cannot stand in for the second. Second, 2021 and 2022 play opposite roles — 2021 was the peak for fixed rates, 2022 was the peak for ARMs. The cohort that needs to get in line early is the 2022 group.
How much seller competition exists at the top of this market right now
Key numbers first: Realtor.com defines luxury as the top 10% of local list prices, and in July 2026 that threshold sat near $3.274M for San Jose–Sunnyvale–Santa Clara — which places $3M–$4M right at the entrance to the Bay Area's high end. At least through summer 2026, competition among sellers in that band stayed limited. Zillow's June 2026 data shows luxury inventory down 26.2% year over year in the San Jose metro and down 39.9% in the San Francisco metro, while May luxury sales rose 2.7% and 21.6% respectively.
| Metric | Reading | Source and scope |
|---|---|---|
| Luxury threshold (San Jose–Sunnyvale–Santa Clara, July 2026) | About $3.274M | Realtor.com, defined as the top 10% of local list prices |
| Local luxury threshold, year over year | −6.9% | Realtor.com July 2026 listing data |
| Luxury inventory, year over year (San Jose metro, June 2026) | −26.2% | Zillow, defined as the top 5% of home values |
| Luxury inventory, year over year (San Francisco metro, June 2026) | −39.9% | Zillow |
| Luxury sales, year over year (San Jose metro, May 2026) | +2.7% | Zillow |
| Luxury sales, year over year (San Francisco metro, May 2026) | +21.6% | Zillow |
| Median days on market, homes above $1M (San Jose metro, July 2026) | About 38 days | Realtor.com listing data |
| Local unemployment rate | About 3.8% | Joint Venture Silicon Valley 2026 regional economic summary |
| Jobs exposed to AI augmentation, restructuring or replacement | About 410,000 | Joint Venture Silicon Valley 2026 regional economic summary |
Scope: the two platforms define luxury differently — Realtor.com takes the top 10% of list prices, Zillow the top 5% of home values. Inventory, sales and days on market are metro-level aggregates under each platform's own definition. They do not convert into one another, and neither stands in for a single city or a specific pocket neighborhood.
What to remember: sell today and you are mostly negotiating with buyers. Sell later and you may also be negotiating with sellers. On the demand side, nothing in the current data supports a claim that buyers are about to weaken — Joint Venture Silicon Valley's 2026 regional summary shows local unemployment near 3.8% and a labor market still close to full employment, while also noting that overall job growth has flattened and estimating roughly 410,000 positions exposed to augmentation, restructuring or replacement from AI. Nothing guarantees the reverse either: that if the pool of would-be sellers grows, buyer numbers and buying power grow at the same pace. No crash is required to change a seller's position. If the number of comparable homes listed in your pocket neighborhood at the same moment goes from two to five or six, a buyer's room to compare and negotiate is a completely different thing.
What MK Group sees on the ground
The 94087 owner we told not to sell
MK Group handled a seller consultation that ended the opposite way from what the owner expected. He held a single-family home in 94087, on the Sunnyvale side of the Cupertino border: 1,800 square feet, three bedrooms and two baths, on a 7,500-square-foot lot, in the Homestead High School attendance area. Nothing was wrong with the house. He wanted to move to Los Altos, but he did not have the capital yet, and neither the target city nor the timing was settled. He had already spoken with three other agents. All three told him to list as soon as possible.
Marie Wang and Kevin Mo walked the property and gave him the opposite advice: do not sell now. The reasoning came down to the loan. His rate was extremely low, and it was a fixed rate — held, it runs the full term of the loan; sold, it is gone permanently. Meanwhile his next step was undefined and underfunded, which meant selling would most likely leave him waiting on the market. The alternative they laid out: keep the low-rate property, raise the next down payment through a HELOC, and rent the current house out — worth holding even if the cash flow only breaks even for now. His reaction at the time: "My God — you are the only ones who told me not to sell." (Translated from Mandarin.)
Same three options, opposite answer on a 7-year ARM
MK Group's approach to a seller consultation is to put three options on one page — sell now, sell in another year, or hold and rent — instead of answering only "what is this house worth?" For the 94087 owner the answer was to hold, and the decisive variable was precisely this: his low rate had no expiry date.
Run the same method for an owner on a 7-year ARM and that variable inverts. The low rate has a defined end, and it most likely ends alongside a batch of owners in the same position. That does not automatically produce "sell now." If the house is genuinely scarce, the cash flow is comfortable, and the plan is to hold for the long run, holding remains entirely rational. What it does is force a recalculation of what "wait two more years" costs. Kevin Mo puts the judgment in one line on YouTube @KevinMoRE (23K+): the best window to sell is usually not the moment everyone realizes they should sell. It is while you still hold the choice.
Common Misconceptions
"I can still afford the payment after it adjusts, so this doesn't apply to me"
Affordability answers the cash-flow question. It does not answer the timing question. What a reset really does is cancel the free reason to keep waiting — and when a group of owners who already wanted to sell lose that reason at the same time, comparable listings can arrive in clusters. So alongside "can I still pay it," the sharper question is: do I want to be deciding whether to sell at the same moment a wave of similar owners starts recalculating what holding is worth?
"ARMs are for buyers who are stretched thin"
Federal Reserve Bank of St. Louis analysis of the 2019 Survey of Consumer Finances shows the opposite picture. Among households with a mortgage, 18.8% of the top income decile held an ARM, against 6.5% of the bottom decile, and ARM holders had a higher median household income. The reason is unglamorous: ARMs ran roughly 2% below fixed rates at the time, and the bigger the loan, the more absolute dollars that same spread saves. These are national figures, not a direct count of Bay Area owners in the $3M–$4M band — but they are enough to show that ARM risk is not the same thing as low-income borrower risk.
"7-year products are 47.8%, so half of Bay Area owners reset in 2029"
That misreads the sample. The denominator behind 47.8% is "ARMs acquired by Fannie Mae and Freddie Mac between 2020 and 2022" — the loan must already be an ARM, and it must also meet agency purchase standards. The jumbo and portfolio loans common on $3M–$4M Bay Area homes are not in that count. Loan economics suggest jumbo ARM usage could be higher, but that is inference, unverified by Bay Area lending data. The safe version is one sentence: ARM usage rose sharply in 2022, and a meaningful share of those were 7-year products maturing around 2029.
"There's almost nothing for sale in the Bay Area, so nobody wants to sell"
FHFA's research argues the reverse. Between Q2 2022 and Q2 2024, rate lock-in removed roughly 1.72 million transactions nationally, with the probability of selling falling about 18.1% per percentage point the market rate sat above an owner's existing rate. Among 150 major metros, San Jose–Sunnyvale–Santa Clara posted an average rate delta of −3.01 percentage points and the highest lock-in in the country, with local sensitivity near 25.6%. A real share of today's thin supply is "wants to sell, cannot afford to give up the rate," not "never wants to sell." That study measured fixed-rate lock-in rather than forecasting ARM resets — but it shows how much deferred intent sits underneath an inventory reading.
"I'll decide in the year it resets — my house is scarce anyway"
Scarcity is a property of a neighborhood and a floor plan, not of a date. The right unit for measuring it is this: at one moment, in your city and your pocket neighborhood, in your price band, how many homes are genuinely competing with yours? Two listings on the same street is a different market from six, and that count is most likely to move in the years when resets cluster. Wait for that year to look, and what you give up is not price. It is optionality.
Next steps
- Pull the loan documents and confirm the exact first-adjustment date plus three terms. Index, margin, and caps — including the initial adjustment cap, the periodic cap, and the lifetime cap. Those three decide how your payment moves on the day it resets, and they deserve your attention before any market forecast does.
- Count how many homes are actually competing with yours right now. Not the citywide median price — the number of active listings in your city, your pocket neighborhood, your price band, and your home type. Record it, update it quarterly, and use it as the baseline for judging your window.
- Run the three ledgers for each of 2027, 2028 and 2029 as a sale year. Taxes (whether the primary-residence exclusion still applies, plus depreciation recapture and capital-gains treatment if you rent it out — have your CPA run your actual situation), cash flow (the post-adjustment payment against market rent), and the price gap on the next house. Three years side by side usually produces a different answer than instinct.
- If the property is already a rental, rebuild the cash flow on post-reset assumptions. Stress-test a range of adjusted rates and find the one that flips cash flow from positive to negative. That break-even is the number your decision should actually track.
- If your path is $3M–$4M to $5M–$6M, align both timelines before you act. Settle the target city, the target home type, and the funding source — sale proceeds, a HELOC, or a combination — before you set a listing date. Reverse that order and the common outcome is selling well and then spending a long time unable to buy.
Further reading: if your question is really about 2027 listing timing and how the playbook differs by city and price band, see I was planning to sell anyway — should I list this year or wait until 2027, and will the Bay Area be harder to sell then?